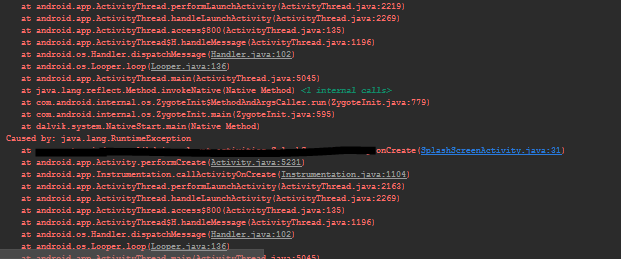
Unfortunately MyApp has stopped. How can I solve this?
Asked Answered
B

23

882

I am developing an application, and everytime I run it, I get the message:

Unfortunately, MyApp has stopped.

What can I do to solve this?


About this question - obviously inspired by What is a stack trace, and how can I use it to debug my application errors?, there are lots of questions stating that their application has crashed, without any further detail. This question aims to instruct novice Android programmers on how to try and fix their problems themselves, or ask the right questions.

Butterandeggs answered 28/4, 2014 at 23:55 Comment(4)
I've seen many questions getting closed as dupes with this. This is a good reference for helping people post relevant data in their questions. However, this isn't a duplicate of any root problem there but just methodology for digging out the root problem. I think it would be better just to provide the link to this question as a reference and not close as duplicate.Maryettamaryjane
I think the close function is perfect for this. Most of these questions show little knowledge of the basic debugging skills. Putting them on hold provides a chance for them to clarify their problem, using the method as stated in the answer. Better yet, they might be able to solve the problem themselves. This discussion might be better suited for meta.stackoverflow.com though.Butterandeggs
This question is too vague. A better question would be 'using [myIDE] how do I debug' an Android application that's displaying the error 'Unfortunately, MyApp has stopped'Bidet
@ChrisHalcrow This Q/A is not about debugging at all. It is about guiding beginners in Android how to deal with app crashes.Butterandeggs
B
777

This answer describes the process of retrieving the stack trace. Already have the stack trace? Read up on stack traces in "What is a stack trace, and how can I use it to debug my application errors?"

The Problem

Your application quit because an uncaught RuntimeException was thrown.
The most common of these is the NullPointerException.

How to solve it?

Every time an Android application crashes (or any Java application for that matter), a Stack trace is written to the console (in this case, logcat). This stack trace contains vital information for solving your problem.

Android Studio

Finding the stack trace in Android Studio

In the bottom bar of the window, click on the Logcat button. Alternatively, you can press alt+6. Make sure your emulator or device is selected in the Devices panel. Next, try to find the stack trace, which is shown in red. There may be a lot of stuff logged into logcat, so you may need to scroll a bit. An easy way to find the stack trace is to clear the logcat (using the recycle bin on the right), and let the app crash again.

I have found the stack trace, now what?

Yay! You're halfway to solving your problem.
You only need to find out what exactly made your application crash, by analyzing the stack trace.

Read up on stack traces in "What is a stack trace, and how can I use it to debug my application errors?"

I still can't solve my problem!

If you've found your Exception and the line where it occurred, and still cannot figure out how to fix it, don't hesitate to ask a question on StackOverflow.

Try to be as concise as possible: post the stack trace, and the relevant code (e.g. a few lines up to the line which threw the Exception).

Butterandeggs answered 28/4, 2014 at 23:55 Comment(7)
I know this post is old: but if you use IntelliJ IDEA you can go inside Android > Devices|Logcat and add a new filter (i.imgur.com/145dtkx.png), and filter it for by Log Message here you can put FATAL EXCEPTION (i.imgur.com/HpELhaU.png) so in this Box you can read all Exceptions which are throw by your application. With this you don't need to clear logcat and do the crash again. I think Android Studio have this option too.Lyndel
Filtering logcat in Eclipse can be done by typing in the java package name in the application name field of the filter.Amoritta
I think the main point is understanding the trace back one gets when the exception happens. FCs are a bit bad when there is no trace back or not a usable one, which is where it gets hairy. but I think this explanation is a nice first intro in finding/identifying such bugs.Therron
Things are easy when your logcat has some trace of error, but what in case logcat has nothing? stackoverflow.com/questions/32455645/…Joses
For IntelliJ users, the window will be "Android Monitor" (kind of self explanatory)Finland
The problem is the line does not contain the error which is written and pointed by the stack trace.Cognation
In case there is nothing in Logcat, Then developer needs to filter the logs by doing following steps: 1. Select Package ID of Application 2. Choose Verbose from Options 3. Select 'No Filters' rather than 'Show only selected application' In this way, Logs will appear after you restart the application. Hope it helps !Collyer
L
133

You can use Google's ADB tool to get Logcat file to analyze the issue.

adb logcat > logcat.txt

open logcat.txt file and search for your application name. There should be information on why it failed, the line number, Class name, etc.

Lamaism answered 22/3, 2015 at 23:6 Comment(3)
This is great, it'll show you quickly anything going on on the device even if your debugger is failing to catch it, which can happen for Xamarin if the runtime fails to load.Contagium
I couldn't see why my app was crashing in the android studio logcat, there were no errors at all. This answer gave me what I needed. Later on however I realised that I had some filter on in the studio logcat which was preventing me from seeing the error. I switched back to "Show only selected application" and I was back up and running.Chuchuah
you should add -d, otherwise you nave to ctrl-C to exit logcat. I do adb logcat -v time -d > filename.txtEnchant
R
45

First, you check which point your app has crashed (Unfortunately, MyApp has stopped.). For this, you can use Log.e("TAG", "Message");, using this line you can see your app log in logcat.

After that, you find which point your app has stopped it's very easy to solve at your side.

Regrate answered 18/3, 2015 at 8:1 Comment(0)
A
36

Just check the error in log cat.

You get the log cat option from in eclipse:

window->show view->others->Android->Logcat

Log cat contains error.

Other wise you can also check the error by executing an application in debug mode. Firstly set breakpoint after that by doing:

right click on project->debug as->Android application

Amend answered 11/6, 2015 at 10:58 Comment(0)
C
34

Note: This answer is using Android Studio 2.2.2

Note 2: I am considering that your device is successfully connected.


The first thing you do when your application crashes is looking into the LogCat, at the bottom of Android Studio there's a toolbar with a list of menus:

image

Click on the "Android Monitor" (The one I underlined in the image above. ^)

Now, you'll get something like this:

image

Change "Verbose" to "Error" Now it will only show you logged errors. Don't worry about all these errors (if you got them) now.

image

Ok. Now, do what you did to crash your app. After your app crashes, go to your logcat. You should find a new crash log that has a lot of at:x.x.x: and Caused by: TrumpIsPresidentException for example. Go to that Caused by: statement in your logcat.

image

Next to that Caused By:, there should be the Exception that happened. In my case, it's a RuntimeException and under it there should be a line that contains a blue link such as:

image

If that Caused by: DOESN'T have a line with a blue text somewhere under it, then look for another Caused by: that does.

Click on that blue link. It should take you to where the problem occurred. In my case, it was due to this line:

throw new RuntimeException();

So, now I know why it's crashing. It's because I'm throwing the exception myself. This was an obvious error.


However, let's say I got another error:

java.lang.NullPointerException

I checked my logcat, I clicked on the blue link it gave me, and it took me here:

mTextView.setText(myString);

So, now I want to debug. According to this StackOverflow question, a NullPointerException says that something is null.

So, let's find out what is null. There are two possibilities. Either mTextView is null, or myString is null. To find out, before the mTextView.setText(mString) line, I add these two lines:

Log.d("AppDebug","mTextView is null: " + String.valueOf(mTextView == null);
Log.d("AppDebug","myString is null: " + String.valueOf(myString== null);

Now, like we did previously (We changed Verose to Error), we want to change "Error" to "Debug". Since we're logging by debugging. Here are all the Log methods:

Log.
  d means Debug
  e means error
  w means warning
  v means verbose
  i means information
  wtf means "What a terrible failure". This is similar to Log.e

So, since we used Log.d, we're checking in Debug. That's why we changed it to debug.

Notice Log.d has a first parameter,in our case "AppDebug". Click on the "No Filters" drop down menu on the top-right of the logcat. Select "Edit Filter Configuration", give a name to your filter, and in "Log Tag" put "App Debug". Click "OK". Now, you should see two lines in the logcat:

yourPackageNameAndApp: mTextView is null: true
yourPackageNameAndApp: myString is null: false

So now we know that mTextView is null.

I observe my code, now I notice something.

I have private TextView mTextView declared at the top of my class. But, I'm not defining it.

Basically, I forgot to do this in my onCreate():

mTextView = (TextView) findViewById(R.id.textview_id_in_xml);

So THAT'S why mTextView is null, because I forgot to tell my app what it is. So I add that line, run my app, and now the app doesn't crash.


Cognizant answered 6/11, 2016 at 9:23 Comment(1)
This is good information, but using images of the Stack Trace diminishes its usefulness - images can't be searched, can't be copied and pasted, can't be picked up by screen readers, and are more difficult to read. (I didn't downvote, by the way, just pointing that out).Courbet
H
23

This popup shows only when you get a fatal exception in your code which stops the execution of the app. It could be any exception NullPointerException, OutOfMemoryException etc.

Best way to check is through Logcat if you are still developing the app in Android studio which is quick way to read stack trace and check the cause of the app.

If your app is already live, then you can not use logcat. So, for that you can implement Crashlytics to provide you bug reports of any exception that occurs.

Hurleigh answered 4/7, 2017 at 4:38 Comment(0)
B
20

Check your Logcat message and see your Manifest file. There should be something missing like defining the Activity,User permission`, etc.

Bricklaying answered 29/6, 2015 at 11:48 Comment(0)
A
17

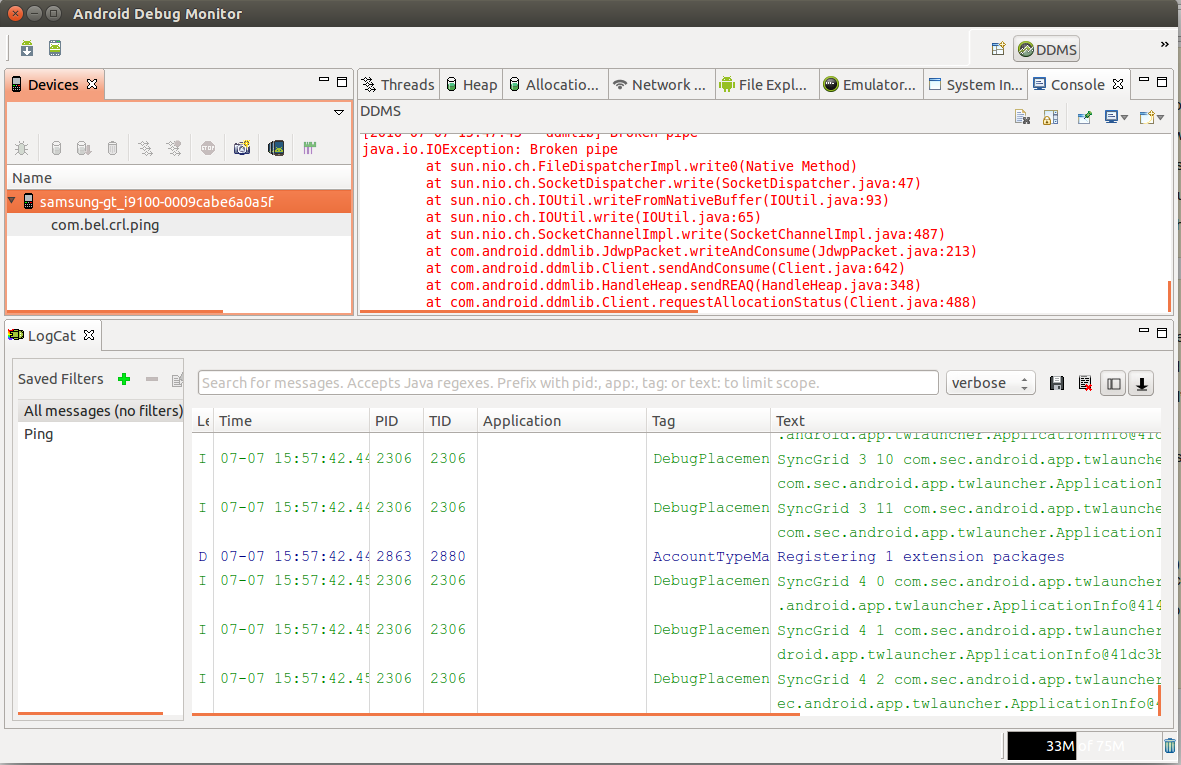
You can use any of these tools:

  1. adb logcat

  2. adb logcat > logs.txt (you can use editors to open and search errors.)

  3. eclipse logcat (If not visible in eclipse, Go to Windows->Show View->Others->Android->LogCat)

  4. Android Debug Monitor or Android Device Monitor(type command monitor or open through UI)

enter image description here

  1. Android Studio

I suggest to use Android Debug Monitor, it is good. Because eclipse hangs when too many logs are there, and through adb logcat filter and all difficult.

Arsenopyrite answered 3/11, 2015 at 5:47 Comment(0)
M
13

You have to check the Stack trace

How to do that?

on Your IDE Check the windows form LOGCAT

If you cant see the logcat windows go to this path and open it

window->show view->others->Android->Logcat

if you are using Google-Api go to this path

adb logcat > logcat.txt

Masteratarms answered 13/7, 2015 at 8:37 Comment(0)
U
12

Let me share a basic Logcat analysis for when you meet a Force Close (when the app stops working).

DOCS

The basic tool from Android to collect/analyze logs is the logcat.

HERE is the Android's page about logcat

If you use android Studio, you can also check this LINK.

Capturing

Basically, you can MANUALLY capture logcat with the following command (or just check AndroidMonitor window in AndroidStudio):

adb logcat

There's a lot of parameters you can add to the command which helps you to filter and display the message that you want... This is personal... I always use the command below to get the message timestamp:

adb logcat -v time

You can redirect the output to a file and analyze it in a Text Editor.

Analyzing

If you app is Crashing, you'll get something like:

07-09 08:29:13.474 21144-21144/com.example.khan.abc D/AndroidRuntime: Shutting down VM
07-09 08:29:13.475 21144-21144/com.example.khan.abc E/AndroidRuntime: FATAL EXCEPTION: main
    Process: com.example.khan.abc, PID: 21144
    java.lang.NullPointerException: Attempt to invoke virtual method 'void android.support.v4.app.FragmentActivity.onBackPressed()' on a null object reference
     at com.example.khan.abc.AudioFragment$1.onClick(AudioFragment.java:125)
     at android.view.View.performClick(View.java:4848)
     at android.view.View$PerformClick.run(View.java:20262)
     at android.os.Handler.handleCallback(Handler.java:815)
     at android.os.Handler.dispatchMessage(Handler.java:104)
     at android.os.Looper.loop(Looper.java:194)
     at android.app.ActivityThread.main(ActivityThread.java:5631)
     at java.lang.reflect.Method.invoke(Native Method)
     at java.lang.reflect.Method.invoke(Method.java:372)
     at com.android.internal.os.ZygoteInit$MethodAndArgsCaller.run(ZygoteInit.java:959)
     at com.android.internal.os.ZygoteInit.main(ZygoteInit.java:754)
07-09 08:29:15.195 21144-21144/com.example.khan.abc I/Process: Sending signal. PID: 21144 SIG: 9

This part of the log shows you a lot of information:

  • When the issue happened: 07-09 08:29:13.475

It is important to check when the issue happened... You may find several errors in a log... you must be sure that you are checking the proper messages :)

  • Which app crashed: com.example.khan.abc

This way, you know which app crashed (to be sure that you are checking the logs about your message)

  • Which ERROR: java.lang.NullPointerException

A NULL Pointer Exception error

  • Detailed info about the error: Attempt to invoke virtual method 'void android.support.v4.app.FragmentActivity.onBackPressed()' on a null object reference

You tried to call method onBackPressed() from a FragmentActivity object. However, that object was null when you did it.

  • Stack Trace: Stack Trace shows you the method invocation order... Sometimes, the error happens in the calling method (and not in the called method).

    at com.example.khan.abc.AudioFragment$1.onClick(AudioFragment.java:125)

Error happened in file com.example.khan.abc.AudioFragment.java, inside onClick() method at line: 125 (stacktrace shows the line that error happened)

It was called by:

at android.view.View.performClick(View.java:4848)

Which was called by:

at android.view.View$PerformClick.run(View.java:20262)

which was called by:

at android.os.Handler.handleCallback(Handler.java:815)

etc....

Overview

This was just an overview... Not all logs are simple but the error gives specific problem and verbose shows up all problem ... It is just to share the idea and provide entry-level information to you...

I hope I could help you someway... Regards

Umbrian answered 14/7, 2016 at 3:21 Comment(0)
A
12

In below showToast() method you have to pass another parameter for context or application context by doing so you can try it.

  public void showToast(String error, Context applicationContext){
        LayoutInflater inflater = getLayoutInflater();
        View view = inflater.inflate(R.layout.custom_toast, (ViewGroup)      
        findViewById(R.id.toast_root));
        TextView text = (TextView) findViewById(R.id.toast_error);
        text.setText(error);
        Toast toast = new Toast(applicationContext);
        toast.setGravity(Gravity.TOP | Gravity.FILL_HORIZONTAL, 0, 0);
        toast.setDuration(Toast.LENGTH_SHORT);
        toast.setView(view);
        toast.show();
}
Aubade answered 3/4, 2017 at 9:37 Comment(0)
H
9

Use the LogCat and try to find what is causing the app to crash.

To see Logcat if you use Android Studio then Press ALT + 6 or

if you use Eclipse then Window -> Open Perspective -> Other - LogCat

Go to the LogCat, from the drop down menu select error. This will contain all the required information to help you debug. If that doesn't help, post the LogCat as an edit to your question and somebody will help you out.

Hus answered 15/5, 2016 at 7:45 Comment(0)
K
8

If your app for some reason crashes without good stacktrace. Try debug it from first line, and go line by line until crash. Then you will have answer, which line is causing you trouble. Proably you could then wrapp it into try catch block and print error output.

Khudari answered 2/10, 2017 at 15:7 Comment(0)
O
7

You can also get this error message on its own, without any stack trace or any further error message.

In this case you need to make sure your Android manifest is configured correctly (including any manifest merging happening from a library and any activity that would come from a library), and pay particular attention to the first activity displayed in your application in your manifest files.

Orwin answered 22/3, 2015 at 8:50 Comment(1)
I would be interested if you could upload a project that demonstrates this phenomenon.Foreclose
C
6

People make mistakes, and so coding as well.

When ever any error happened, always check with the logcat with the text in red color however u can find out the real problem in blue color text with underline in those red color text.

Make sure if u create a new activity, always declare the activity in the AndroidManifest file.

If adding Permission, declare it in the AndroidMainifest file as well.

Crutchfield answered 19/5, 2018 at 17:24 Comment(0)
S
6

Crash during development

Try my favourite tool logview to get the logs and analyze them during development.
Make sure to mark ./logview and ./lib/logview.jar as executable when running in Linux.

If you don't like it, there're a lot of alternative desktop log viewers for Android.

Crash in the wild

Integrate a real-time crash reporting tool such as Firebase Crashlytics in order to get stacktraces of unhandled exceptions which occurred on users' devices.

Read How to Release a Buggy App (And Live to Tell the Tale) to know more about handling bugs in the field.

Suki answered 11/9, 2018 at 8:35 Comment(0)
R
6

Logcat - To check the logs in the development phase of Android Studio

Initially clear the Logcat and let the app crash again so you can get only crashed log detail. You have to check the Stack trace

While, Unfortunately, MyApp has stopped. There are many reasons for it. You can check same in logs. For this, you can use the Log.e("TAG","Message");

Common error during app crash like:

  1. Coding mistake(Wrong use of keywords).
  2. Mismatch property name.
  3. Unsupported plugin(maybe).
  4. Mismatch version(maybe).
  5. Activity missing in AndroidManifest file.
  6. Permission missing in AndroidManifest file.
  7. Most common NullPointerException.
  8. Declared but not defined.

To resolve app crash error:

  • Keep in mind above points and go through it.
  • With the error, you will get the file name also in blue colour (click on them and jump to code from error is occurring).
Revolve answered 26/3, 2019 at 4:42 Comment(0)
F
5

If you don't have any kind of interesting log in your terminal (or they are not directly related to your app), maybe your problem is due to a native library. In that case, you should check for the "tombstone" files within your terminal.

The default location for the tombstone files depends on every device, but if that's the case, you will have a log telling: Tombstone written to: /data/tombstones/tombstone_06

For more information, check on https://source.android.com/devices/tech/debug.

Flatfooted answered 12/6, 2019 at 13:7 Comment(0)
C
4

First, you need to check where and why your app has been crashed (Unfortunately, MyApp has stopped.). With the help of LOG, you can figure it out what went wrong.

After that, you find which point your app has stopped fix that from your point.

Castellany answered 22/5, 2019 at 10:40 Comment(0)
Q
3

Also running this command in terminal can help find the problem:

gradlew build > log.txt 2>details.txt

then you should go to gradlew file location in read two above log files.

Quirita answered 16/3, 2020 at 10:18 Comment(0)
E
3

I'll Suggest something like this.

  1. Check if your phone has good enough space that the app can run----prior/

  2. Check the logcat when the app crashes. It will show the exact line where the app crashed.

  3. Check if you are using something on the main thread that uses a lot of memory due to ANR.

Ecstatics answered 17/8, 2021 at 7:55 Comment(0)
S
2

Check your Logcat message. Also, see your Manifest file for missing elements like defining the Activity, User permission, etc.

To see Logcat if you use Android Studio then Press alt+6 or

if you use Eclipse then Window -> Open Perspective -> Other - LogCat

Now, from the drop-down menu select error.

Alternatively, you can use ADB tool to get the Logcat file to analyze the issue.

adb logcat > logcat.txt

Now open the logcat.txt file and search for your application name. There should be information on why it failed, the line number, Class name, etc.

Streaming answered 15/7, 2022 at 13:6 Comment(0)
P
-3

If your app crashed without any errors, and you didn't use an asset manager but loaded the textures like:

Texture texture = new Texture("myImage.png"); //dont to this all the time

then that's the problem. I had that happen to me. You should always use an asset manager to avoid a memory overload.

Passbook answered 4/6, 2021 at 8:13 Comment(1)
@MohammadBahadori OP didn't provide a single line of code, how am I going to post a specific solution? The "complete solution" is to use an asset manager, people can learn how to use the asset manager themselves, there are enough guides.Passbook

© 2022 - 2024 — McMap. All rights reserved.