I'm attempting to benchmark the memory bandwidth on a ccNUMA system with 2x Intel(R) Xeon(R) Platinum 8168:
- 24 cores @ 2.70 GHz,
- L1 cache 32 kB, L2 cache 1 MB and L3 cache 33 MB.
As a reference, I'm using the Intel Advisor's Roofline plot, which depicts the bandwidths of each CPU data-path available. According to this, the bandwidth is 230 GB/s.
In order to benchmark this, I'm using my own little benchmark helper tool which performs timed experiments in a loop. The API offers an abstract class called experiment_functor
which looks like this:
class experiment_functor
{
public:

    //+/////////////////
    // main functionality
    //+/////////////////

    virtual void init() = 0;

    virtual void* data(const std::size_t&) = 0;

    virtual void perform_experiment() = 0;

    virtual void finish() = 0;
};
The user (myself) can then define the data initialization, the work to be timed i.e. the experiment and the clean-up routine so that freshly allocated data can be used for each experiment. An instance of the derived class can be provided to the API function:
perf_stats perform_experiments(experiment_functor& exp_fn, const std::size_t& data_size_in_byte, const std::size_t& exp_count)
Here's the implementation of the class for the Schönauer vector triad:
class exp_fn : public experiment_functor
{
    //+/////////////////
    // members
    //+/////////////////

    const std::size_t data_size_;
    double* vec_a_ = nullptr;
    double* vec_b_ = nullptr;
    double* vec_c_ = nullptr;
    double* vec_d_ = nullptr;

public:

    //+/////////////////
    // lifecycle
    //+/////////////////

    exp_fn(const std::size_t& data_size)
        : data_size_(data_size) {}

    //+/////////////////
    // main functionality
    //+/////////////////

    void init() final
    {
        // allocate
        const auto page_size = sysconf(_SC_PAGESIZE) / sizeof(double);
        posix_memalign(reinterpret_cast<void**>(&vec_a_), page_size, data_size_ * sizeof(double));
        posix_memalign(reinterpret_cast<void**>(&vec_b_), page_size, data_size_ * sizeof(double));
        posix_memalign(reinterpret_cast<void**>(&vec_c_), page_size, data_size_ * sizeof(double));
        posix_memalign(reinterpret_cast<void**>(&vec_d_), page_size, data_size_ * sizeof(double));
        if (vec_a_ == nullptr || vec_b_ == nullptr || vec_c_ == nullptr || vec_d_ == nullptr)
        {
            std::cerr << "Fatal error, failed to allocate memory." << std::endl;
            std::abort();
        }

        // apply first-touch
        #pragma omp parallel for schedule(static)
        for (auto index = std::size_t{}; index < data_size_; index += page_size)
        {
            vec_a_[index] = 0.0;
            vec_b_[index] = 0.0;
            vec_c_[index] = 0.0;
            vec_d_[index] = 0.0;
        }
    }

    void* data(const std::size_t&) final
    {
        return reinterpret_cast<void*>(vec_d_);
    }

    void perform_experiment() final
    {
        #pragma omp parallel for simd safelen(8) schedule(static)
        for (auto index = std::size_t{}; index < data_size_; ++index)
        {
            vec_d_[index] = vec_a_[index] + vec_b_[index] * vec_c_[index]; // fp_count: 2, traffic: 4+1
        }
    }

    void finish() final
    {
        std::free(vec_a_);
        std::free(vec_b_);
        std::free(vec_c_);
        std::free(vec_d_);
    }
};
Note: The function data serves a special purpose in that it tries to cancel out effects of NUMA-balancing. Ever so often, in a random iteration, the function perform_experiments writes in a random fashion, using all threads, to the data provided by this function.
Question: Using this I am consistently getting a max. bandwidth of 201 GB/s. Why am I unable to achieve the stated 230 GB/s?
I am happy to provide any extra information if needed. Thanks very much in advance for your answers.
Update:
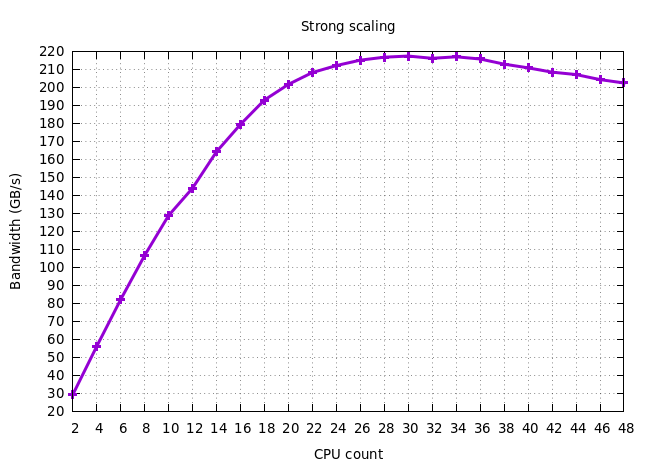
Following the suggestions made by @VictorEijkhout, I've now conducted a strong scaling experiment for the read-only bandwidth.
As you can see, the peak bandwidth is indeed average 217 GB/s, maximum 225 GB/s. It is still very puzzling to note that, at a certain point, adding CPUs actually reduces the effective bandwidth.

