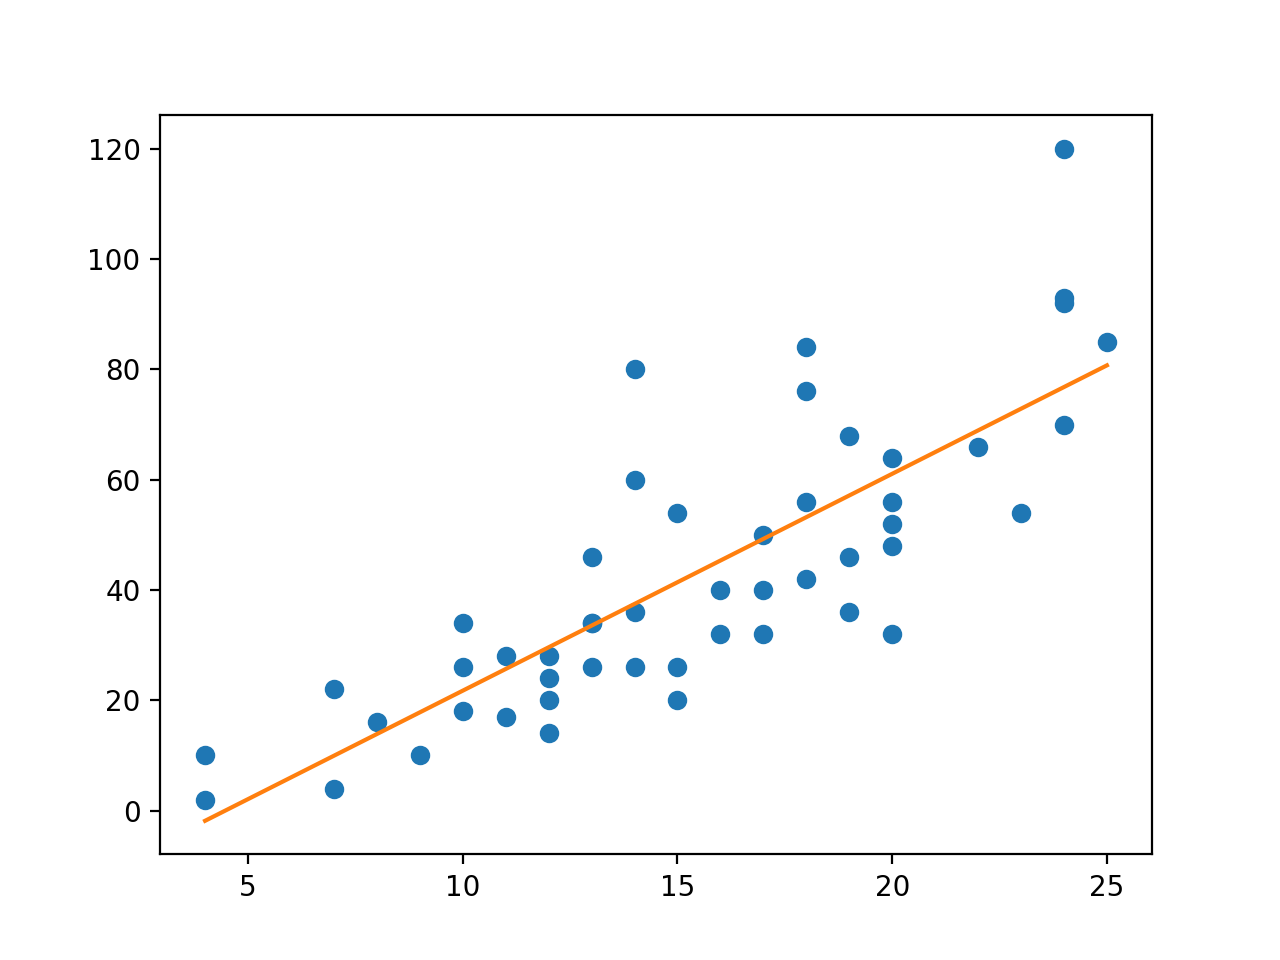
I am trying to plot a Linear Regression onto a scatterplot in Python.
In R I would simply do the following:
Run OLS Linear Regresion
fit_1 <- lm(medv ~ lstat)
plot(medv ~ lstat)
abline(fit_1, col = "red")
I have been looking at different solutions in Python, but I can't seem to be able to actually get it to work.
My script is:
Plot Data
Boston.plot(kind='scatter', x='medv', y='lstat', color = "black")
plt.show()
Run Linear Regression
fit_1 = sm.ols(formula='medv ~ lstat', data= Boston).fit()
Show Summary
fit_1.summary()

