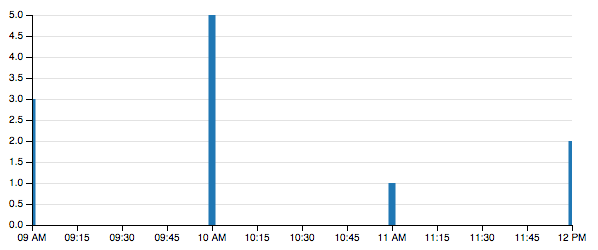
I have a barChart with a d3.time.scale x-axis. I am displaying some data per hour, but the first and last data point bars are always cut in half when using centerBar(true).
(When using centerBar(false) the last bar disappears completely.)
The time window is based upon the data itself and is calculated as follows:
var minDate = dateDim.bottom(1)[0]["timestamp"];
var maxDate = dateDim.top(1)[0]["timestamp"];

.x(d3.time.scale().domain([minDate, maxDate]));
The last line sets the time scale domain to use min and maxDate.
This is how it looks:

I have increased the bar width slightly using .xUnits(function(){return 60;}) as the default is so thin that the first bar disappears within the y-axis.
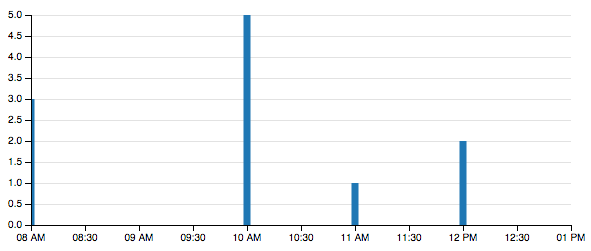
Also I already tried to change the domain by substracting/adding one hour to min/maxDate, but this results in unexpected behaviour of the first bar.

I used the following to calculate the offset:
minDate.setHours(minDate.getHours() - 1);
maxDate.setHours(maxDate.getHours() + 1);
Is there a fix or workaround for this to add padding before the first and after the last bar?
