Smoothed density maps for points in using sf within a given boundary in R
Asked Answered
N

1

5

I'm trying to create a smoothed map for a number of points in R, and I did not find a perfect solution here.

library(mapchina)
library(sf)
library(dplyr)
library(ggplot2)

# Create some sample data
sf_beijing = china %>% 
  filter(Code_Province == '11') %>% 
  st_transform(4326)

sf_points = data.frame(
  lat = c(39.523, 39.623, 40.032, 40.002, 39.933, 39.943, 40.126, 40.548),
  lon = c(116.322, 116, 116.422, 116.402, 116.412, 116.408, 116.592, 116.565)
) %>% 
  st_as_sf(coords = c("lon", "lat"), crs = 4326)

# Plot the boundary for Beijing and the points
ggplot() +
  geom_sf(data = sf_beijing, fill = NA) + 
  geom_sf(data = sf_points, color = 'red') + 
  theme_test()

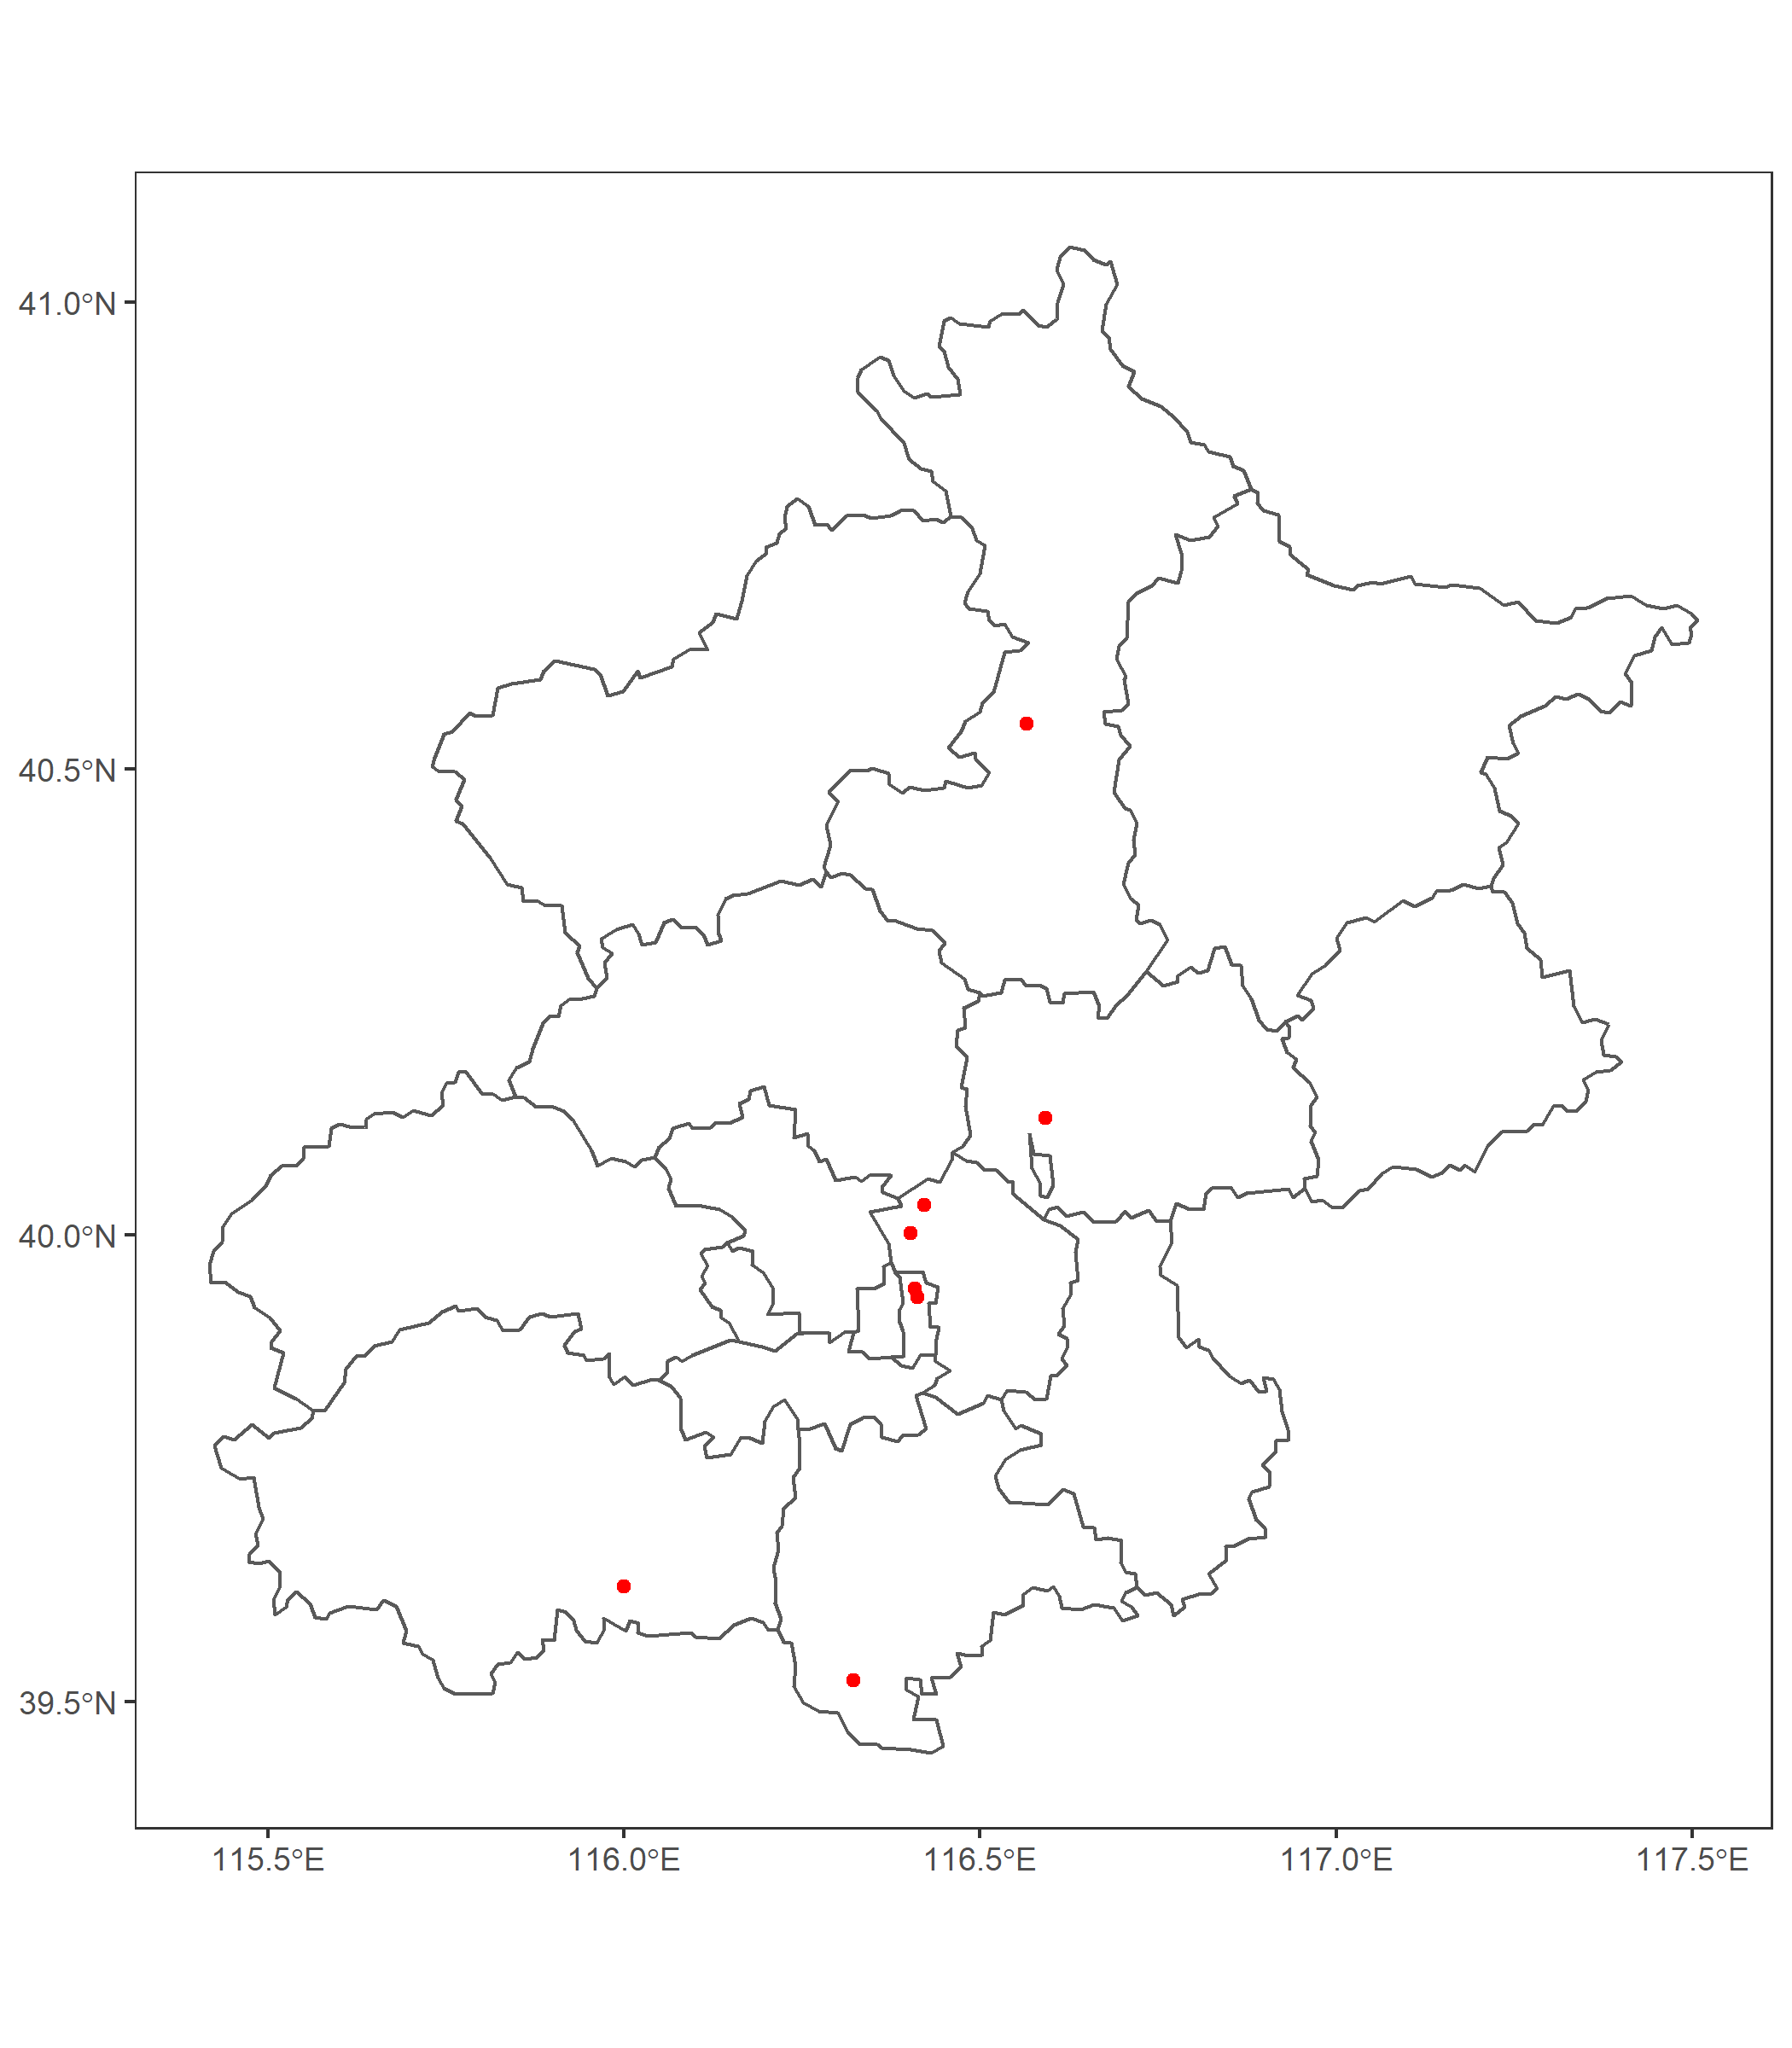
enter image description here

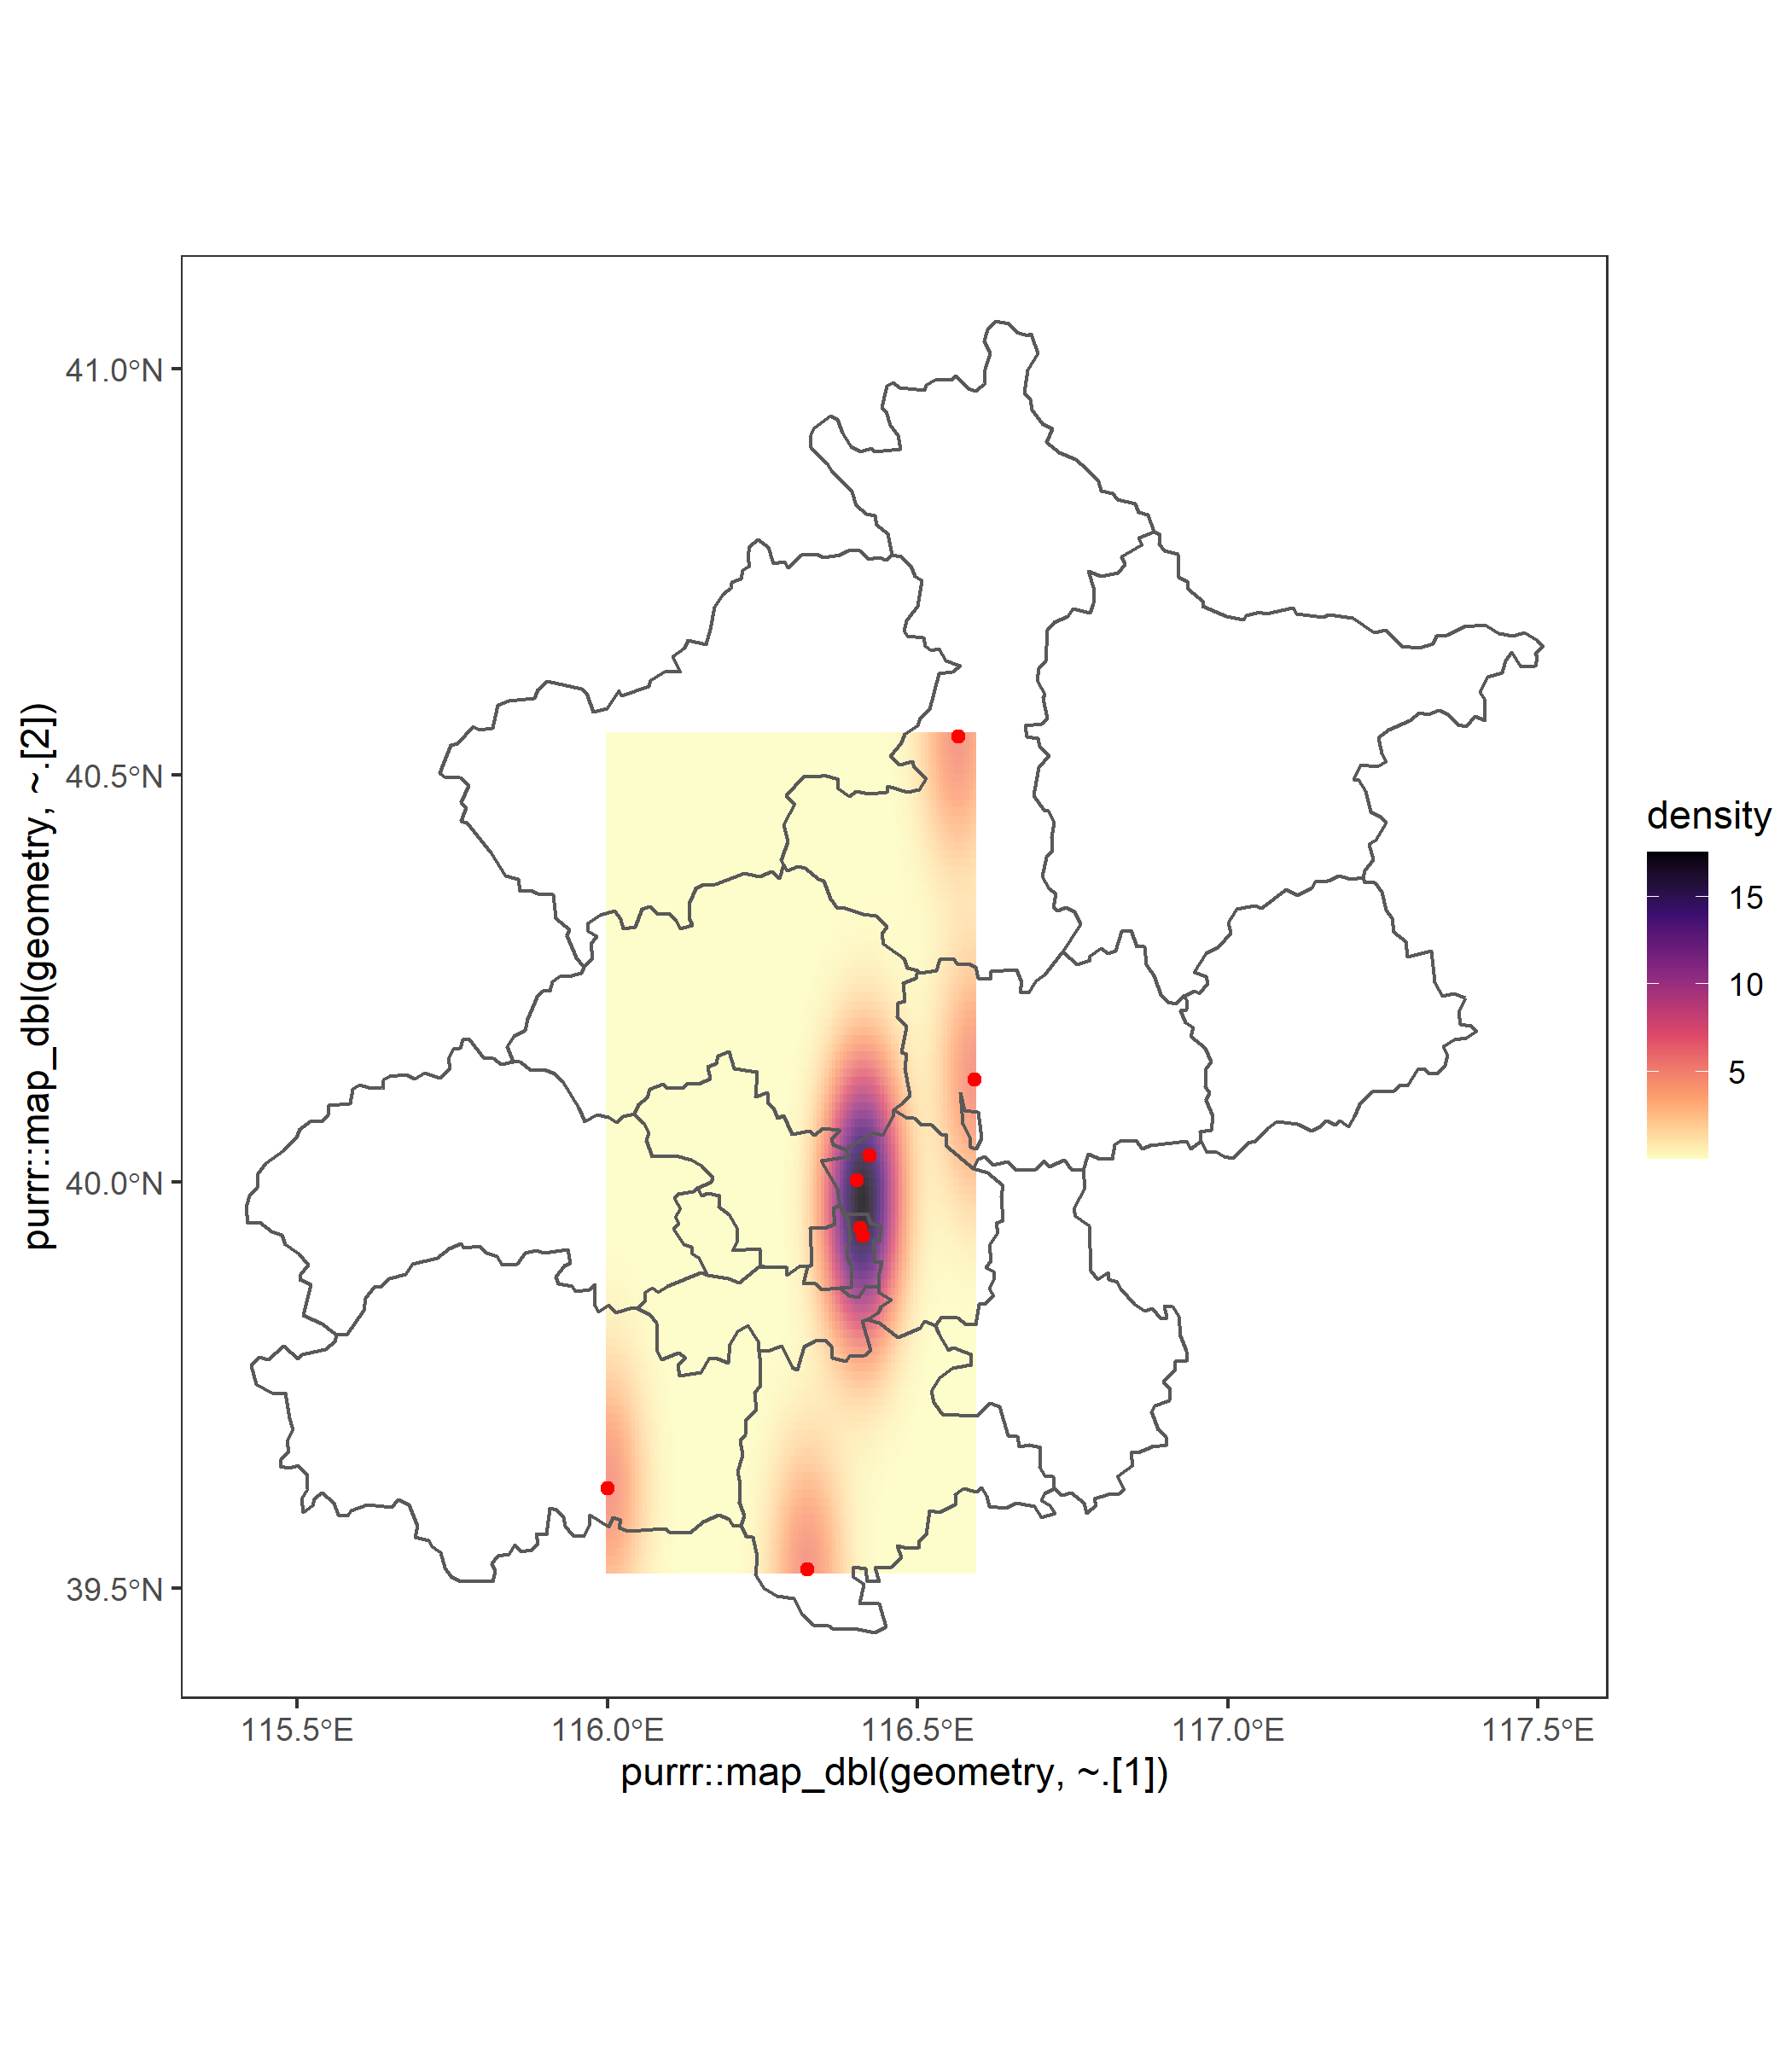
In addition, I found this solution to create a smoothed map for sf points. The issue for this solution is that the smoothed map is not filled entirely in Beijing's boundary, and some of the smoothed parts go beyond the boundary.

ggplot() +
  stat_density_2d(data = sf_points, 
                  mapping = aes(x = purrr::map_dbl(geometry, ~.[1]),
                                y = purrr::map_dbl(geometry, ~.[2]),
                                fill = stat(density)),
                  geom = 'tile',
                  contour = FALSE,
                  alpha = 0.8) +
  geom_sf(data = sf_beijing, fill = NA) + 
  geom_sf(data = sf_points, color = 'red') + 
  scale_fill_viridis_c(option = 'magma', direction = -1) +
  theme_test()
ggsave('p1.png', width = 7, height = 8)

enter image description here

My question is: is there a way to create a smoothed map for these points and the smoothed map fills perfectly within the external boundary (no white space and no ``trespass'')?

Neutrino answered 3/8, 2021 at 22:41 Comment(1)
perhaps like this? https://mcmap.net/q/949659/-how-to-extrapolate-a-raster-using-in-rSicilia
S
9

I want to propose the following approach. It's quite convoluted and there might be more efficient solutions, but I think it works.

Load packages

library(mapchina)
library(sf)
#> Linking to GEOS 3.9.0, GDAL 3.2.1, PROJ 7.2.1
library(spatstat)
#> Loading required package: spatstat.data
#> Loading required package: spatstat.geom
#> spatstat.geom 2.2-2
#> Loading required package: spatstat.core
#> Loading required package: nlme
#> Loading required package: rpart
#> spatstat.core 2.3-0
#> Loading required package: spatstat.linnet
#> spatstat.linnet 2.3-0
#> 
#> spatstat 2.2-0       (nickname: 'That's not important right now') 
#> For an introduction to spatstat, type 'beginner'
library(ggplot2)

Create a polygon and some sample data. Please notice that I set a projected CRS since it's required by spatstat package (see below).

sf_beijing = china %>%
  dplyr::filter(Code_Province == '11') %>%
  st_transform(32650)

sf_points = data.frame(
  lat = c(39.523, 39.623, 40.032, 40.002, 39.933, 39.943, 40.126, 40.548),
  lon = c(116.322, 116, 116.422, 116.402, 116.412, 116.408, 116.592, 116.565)
) %>%
  st_as_sf(coords = c("lon", "lat"), crs = 4326) %>%
  st_transform(32650)

Convert points into ppp object. Check ?ppp and references therein for more details.

ppp_points <- as.ppp(sf_points)

Convert sf_beijing into owin + add window to ppp_points. Check ?Window for more details.

Window(ppp_points) <- as.owin(sf_beijing)

Plot

par(mar = rep(0, 4))
plot(ppp_points, main = "")

Smooth points

density_spatstat <- density(ppp_points, dimyx = 256)

Convert density_spatstat into a stars object. Check https://r-spatial.github.io/stars/index.html for more details.

density_stars <- stars::st_as_stars(density_spatstat)
#> Registered S3 methods overwritten by 'stars':
#>   method            from
#>   st_crs.SpatRaster sf  
#>   st_crs.SpatVector sf

Convert density_stars into an sf object

density_sf <- st_as_sf(density_stars) %>%
  st_set_crs(32650)

Plot

ggplot() +
  geom_sf(data = density_sf, aes(fill = v), col = NA) +
  scale_fill_viridis_c() +
  geom_sf(data = st_boundary(sf_beijing)) +
  geom_sf(data = sf_points, size = 2, col = "black")

Created on 2021-08-04 by the reprex package (v2.0.0)

The smoothed values are estimated using the spatstat package and they fit the original boundary quite well. Increase the value of dimyx if you really need to fill the tiny tiny gaps. Check ?density.ppp and the references therein for more details.

Snailfish answered 4/8, 2021 at 7:27 Comment(2)
If someday you could publish a tutorial of how to do this with a multipolygon sf object would be awesome. Now I am moving to QGIZ because in R I was not able to create the smooth plot I wanted for some crime variables...Gemology
Hi @JohnM.Riveros, could you please share a reproducible example for the multipolygon case? Even better if you create a new question and you link it here.Snailfish

© 2022 - 2024 — McMap. All rights reserved.