Coherence score (u_mass) -18 is good or bad?
Asked Answered
A

3

5

I read this question (Coherence score 0.4 is good or bad?) and found that the coherence score (u_mass) is from -14 to 14. But when I did my experiments, I got a score of -18 for u_mass and 0.67 for c_v. I wonder how is my u_mass score out of range (-14, 14)?

Update: I used gensim library and scanned the numbers of topics from 2 to 50. For u_mass, it starts from 0 to the lowest negative point and turn back a bit, like an upsidedown version of c_v.

Auvergne answered 26/5, 2020 at 22:22 Comment(0)
A
5

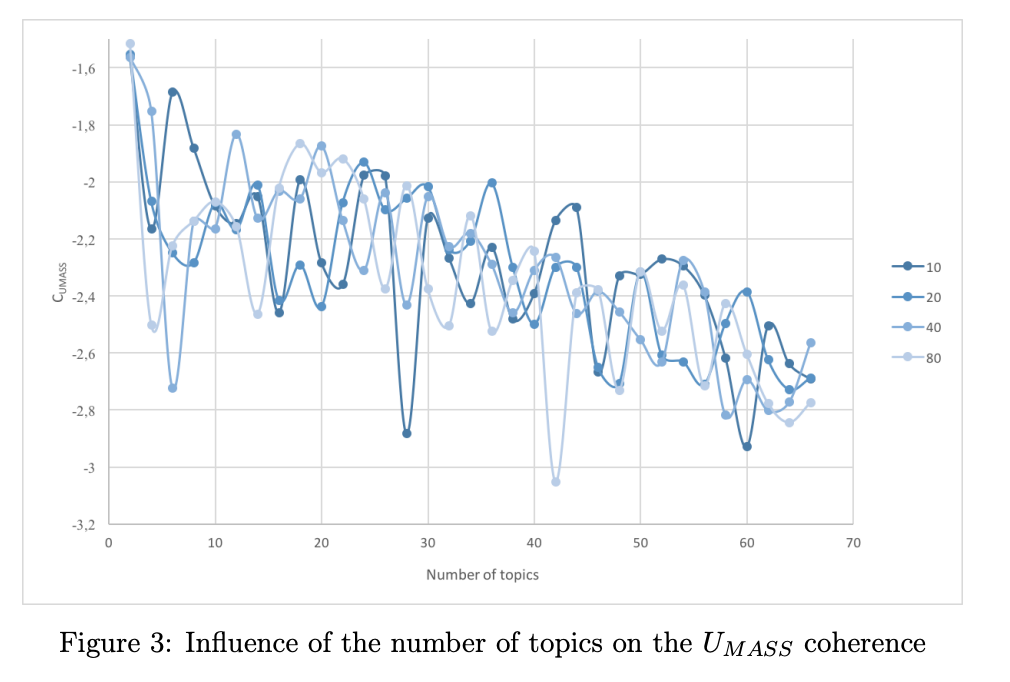
Following what is stated here (pg 13-14), which is the same document mentioned by @Dammio in his answer the interpretation is the opposite. In the text, it says: "According to the UMASS coherence measurements, the coherence of the topics globally decreases when K increases." K is the number of topics. They continue saying: "For the analysis, we compare models with K = 6 for 40 iterations which is a local minimum, and for 10 iterations which performed better." In the figure, it can be clearly seen that it compares the local minimum which is worse with the local maximum which is more coherent. This means exactly the opposite of what is stated in the accepted answer. Besides, I found in a Github post saying exactly the same: higher values are better:Link to Github answer

Figure 4 in pdf document

Arne answered 27/10, 2021 at 13:35 Comment(3)
High is better for "c_v" score and low is better for "u_mass". That is it.Levo
The formula of "u_mass" says better topics will have higher scores.Psychophysics
The accepted answer is incorrect, this should be the correct interpretation. I belive the author simply used a wrong word. It should be local "optima" instead of minimum. It is also just a MSc assignment, NOT a good source of reference.Trella
D
3

According to the mathematical formula for the u_mass coherence score provided in the original paper.

If u_mass closer to value 0 means perfect coherence and it fluctuates either side of value 0 depends upon the number of topics chosen and kind of data used to perform topic clustering. The best way to judge u_mass is to plot curve between u_mass and different values of K (number of topics). Choose K with the value of u_mass close to 0.

You can refer to this link which provides python code snippet to plot curve between different values of K and c_v. Here you can replace c_v with u_mass coherence metric.

I hope this explanation helps.

Derwin answered 27/5, 2020 at 0:49 Comment(3)
I use gensim and my graph is not like you said. It begins from 0 to the lowest point and then turn up to back a bit and fluctuate that point. It looks like a up side down version of c_v. I doubt that gensim do something?Auvergne
Can I see your graph here?Derwin
Here it is: mediafire.com/view/nkq9qw9l55om031/Figure_1.pngAuvergne
C
2

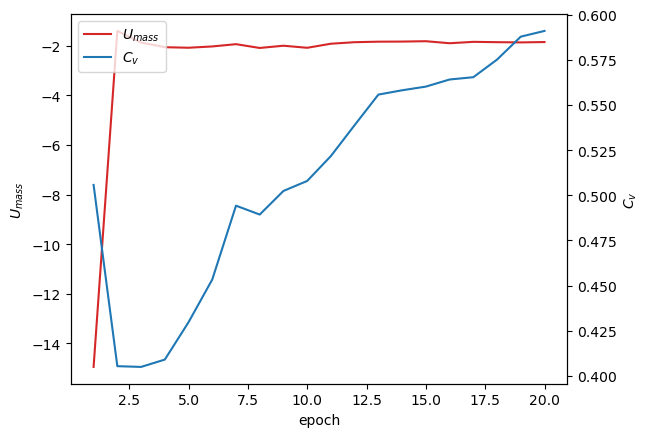
I think the discussion would benefit from a picture showing the convergence of both coherence measures during successful training. In general, we want U_mass to be close to zero and C_V positive highest possible.

Here is an example from my own research: enter image description here

Training looks like

# training

from gensim.models import LdaMulticore
from gensim.models.callbacks import CoherenceMetric, PerplexityMetric
from gensim.models import LdaMulticore, LdaModel

callback1 = CoherenceMetric(corpus=mm_corpus, dictionary=dictionary, coherence='u_mass', title='u_mass')
callback2 = CoherenceMetric(corpus=mm_corpus, texts=docs_tokenized, dictionary=dictionary, coherence='c_v', title='c_v',)
lda = LdaMulticore(mm_corpus, id2word=dictionary, num_topics=20, passes=20, batch=False, callbacks=[callback1,callback2])

I provide the full code in this Kaggle notebook.

Cyclops answered 22/6, 2023 at 6:27 Comment(6)
I like your graph but this is not answer, can you elaborate a bit or convert this into a comment to one of the other well written answers?Trella
@Trella note that I did more than an SO comment, I provided a fully reproducible implementation on Kaggle. Feel free to try it :-).Cyclops
It is awesome that you provide reproducible code. However, it is still not an answer to the question "What is considered a good Umass score?". The key, as you may already know, is to notice that Umass is maximised at 0, and that Umass will worsen as number of topics increased.Trella
Your answer right now is, as you have said, just adding to the discussion. AFAIK, SO answers is expect to be a stand alone answer.Trella
My answer provides a comparison between umass and cv and shows what good values are. Look at the plot. As for the extra code, it is stored where it belongs - in GitHub / Colab / Kaggle.Cyclops
Thanks for editing, it looks better now. ^^Trella

© 2022 - 2024 — McMap. All rights reserved.