Basic WPF LiveCharts DateTime example not working
Asked Answered
S

3

5

I've followed the Live Charts TimeDate basic example as closely as I can but can't seem to get the X axis to display properly.

https://lvcharts.net/App/examples/v1/wpf/Date%20Time

My MainWindow code

public partial class MainWindow : Window
{
    public Func<double, string> Formatter { get; set; }

    public MainWindow()
    {
        InitializeComponent();

        var dayConfig = Mappers.Xy<DateModel>()
          .X(dateModel => dateModel.DateTime.Ticks / TimeSpan.FromDays(1).Ticks)
          .Y(dateModel => dateModel.Value);

        SeriesCollection Series = new SeriesCollection(dayConfig)
        {
            new LineSeries
            {
                Title = "Google Rank",

                Values = new ChartValues<DateModel>
                {
                    new Wpf.CartesianChart.Using_DateTime.DateModel
                    {
                        DateTime    = System.DateTime.UtcNow,
                        Value       = 5
                    },
                    new Wpf.CartesianChart.Using_DateTime.DateModel
                    {
                        DateTime    = System.DateTime.UtcNow.AddDays(1),
                        Value       = 9
                    },
                    new Wpf.CartesianChart.Using_DateTime.DateModel
                    {
                        DateTime    = System.DateTime.UtcNow.AddDays(2),
                        Value       = 4
                    }
                },

                Fill = Brushes.Transparent,

            },
        };

        Formatter = value => new System.DateTime((long)(value * TimeSpan.FromDays(1).Ticks)).ToString("t");

        RankGraph.Series = Series;
    }
}

My XAML on my MainWindow

<Grid>
    <lvc:CartesianChart x:Name="RankGraph" Series="{Binding Series}">
        <lvc:CartesianChart.AxisX>
            <lvc:Axis LabelFormatter="{Binding Formatter}"></lvc:Axis>
        </lvc:CartesianChart.AxisX>
    </lvc:CartesianChart>
</Grid>

Date Model Object

namespace Wpf.CartesianChart.Using_DateTime
{
    public class DateModel
    {
        public DateTime DateTime { get; set; }
        public double Value { get; set; }
    }
}

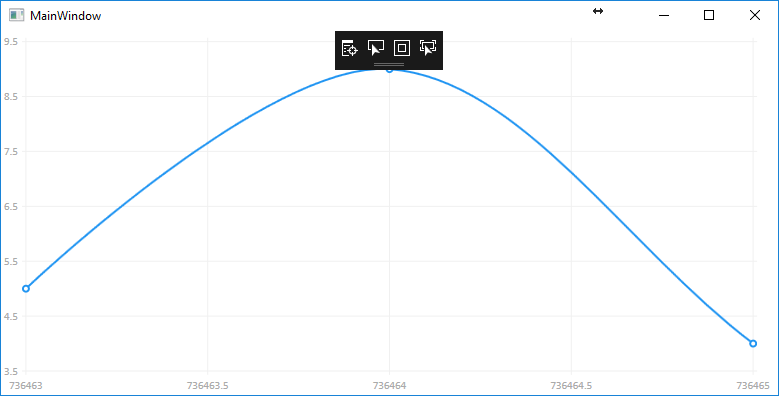
This produces the following with the dates messed up...

enter image description here

Spectrometer answered 15/5, 2017 at 17:14 Comment(0)
B
8

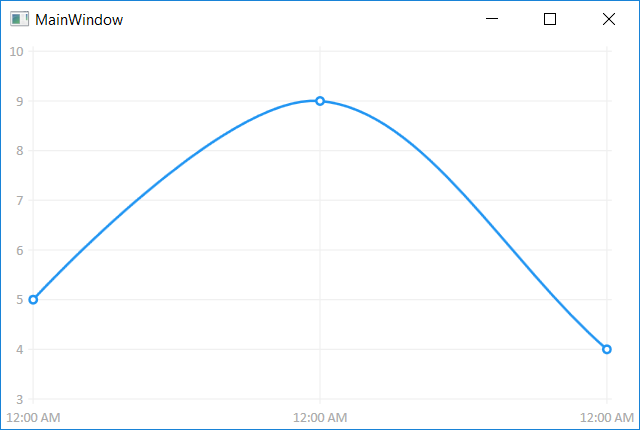
You forgot to set your data context:

DataContext = this;

enter image description here

Bag answered 15/5, 2017 at 17:53 Comment(0)
P
3

For some reason, the LiveCharts bindings in XAML don't work sometimes. You need to name your LiveCharts controls in XAML (to anythin):

<lvc:CartesianChart x:Name="RankGraph" Series="{Binding Series}">
<lvc:Axis x:Name="RankGraphAxisX" LabelFormatter="{Binding Formatter}"></lvc:Axis>

and then bind both Series and LabelFormatter in your code behind:

RankGraph.Series = Series;
RankGraphAxisX.LabelFormatter = Formatter;
Pheni answered 6/11, 2018 at 2:44 Comment(0)
I
0

Dunno if this might be any use to anyone but I read this example code too (which is also published on their site). I kept on reading more about LiveCharts and came across their DateTimePoint class (LiveCharts.Defaults.DateTimePoint). I'm just starting to use these controls, but at first glance it is charting pretty much what I'm expecting to see.

My problem is that I have a bunch of Cartesian points which are of type <DateTime, double>, but the DateTimes are not spread out regularly - so I have data points like ("1 Jan 2015 00:00", 9.5). ("20 Jan 2015 04:00", 10), ("4 Jan 2016 06:46", 5.2), etc. I figured that irregular time intervals are best covered by their Scatter chart, and I'm using WPF to develop my app, so I ended up with the XAML

    ....
    xmlns:x="http://schemas.microsoft.com/winfx/2006/xaml"        
    xmlns:lvc="clr-namespace:LiveCharts.Wpf;assembly=LiveCharts.Wpf"
    ...    
    <lvc:CartesianChart DataTooltip="{x:Null}">
        <lvc:CartesianChart.Series>
            <lvc:ScatterSeries Title="Raw Data" Values="{Binding RawDataSeries}" />
        </lvc:CartesianChart.Series>
        ....

Now, I happen to be taking an MVVM approach (note my binding) so in my corresponding ViewModel, I've written the method

public ChartValues<DateTimePoint> RawDataSeries
{
    get
    {
        ChartValues<DateTimePoint> Values = new ChartValues<DateTimePoint>();
        foreach (DatabaseEntry dbe in _Readings)
        {
            Values.Add(new DateTimePoint(dbe.Timestamp, dbe.Value));
        }
        return Values;
    }
}

Obviously this is a lot less code than on their web page. DatabaseEntry is one of mine - it's just a container for 7 or 8 properties, including Timestamp (DateTime) and Value (double).

I'm still writing this code so I'm sure I have more to do, but just in terms of starting off I'm seeing pretty much what I'm expecting to see so far.

Infirmary answered 24/12, 2018 at 9:52 Comment(1)
Looking into it a bit more it just looks like they're using DateTime.Ticks and casting that to a double, to be contained in an ObservablePoint. I'm currently seeing labels of e.g. 6E17, rather than a datetime, so will have to work out how to format these properly. But hopeful it'll still be less code.Infirmary

© 2022 - 2024 — McMap. All rights reserved.