Plot surface from irregular data
Asked Answered
W

1

3

I'm make a filled contour or surface plot from a scattered dataset.

A major difference from other Qs is that the data are not convex.

[r,th] = meshgrid(10:15,0:180);
[x,y] = deal(r.*sind(th), r.*cosd(th));
z = x.^2+y.^2;
scatter(x(:),y(:),[],z(:),'fill'); axis equal off;

The inner circle is null.

enter image description here

I use

tri = delaunay(x,y);
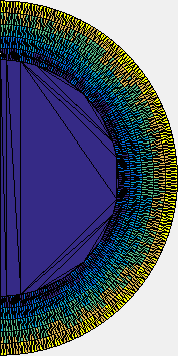
trisurf(tri,x,y,z);  view(2); axis equal off;

to make a surface plot.

However, as you can see, the inner circle is filled.

enter image description here

Welterweight answered 30/3, 2017 at 18:16 Comment(0)
M
6

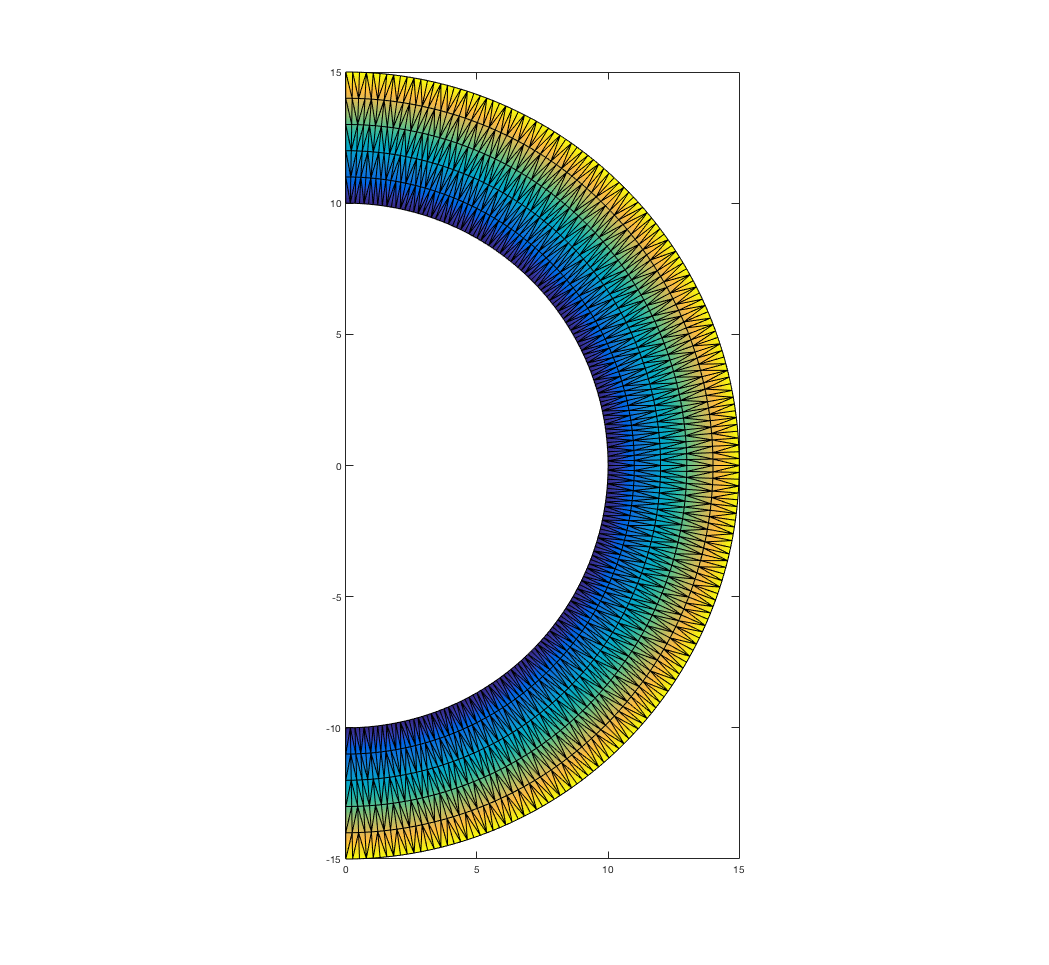
Rather than using the Delaunay triangulation which results in the convex hull, you're going to want to use an alphaShape with which you can impose a limit on the length of the resulting surfaces edges.

You can specify the Alpha property (by specifying a third input) which is the inverse of the maximum edge length. For your example, I've chosen an Alpha of 1.

A = alphaShape(x(:), y(:), 1);

You can then get the triangulation out using the alphaTriangulation method of your alphaSurface object.

[faces, vertices] = A.alphaTriangulation();
zvalue = sum(vertices.^2, 2);

Or you can use the plot method of the alphaShape object

plot(A, 'FaceColor', 'interp', 'CData', zvalue)

enter image description here

Maxim answered 30/3, 2017 at 18:29 Comment(1)
Thanks for the complementary alphaTriangulation. Works perfect.Welterweight

© 2022 - 2024 — McMap. All rights reserved.