candlestick plot from pandas dataframe, replace index by dates
Asked Answered
P

3

5

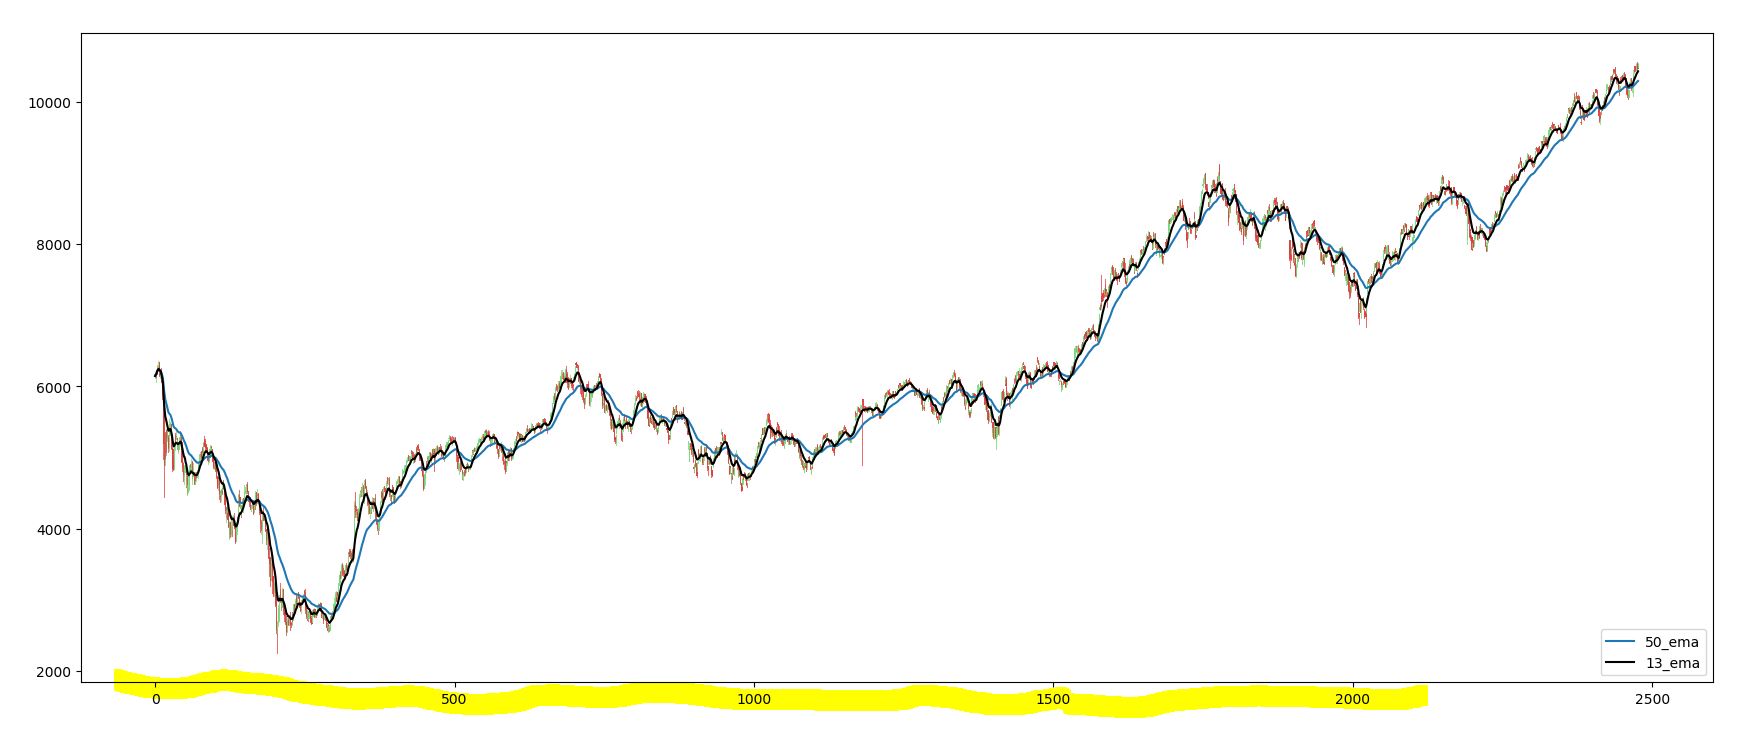
This code gives plot of candlesticks with moving averages but the x-axis is in index, I need the x-axis in dates. What changes are required?

import numpy as np
import pandas as pd
import matplotlib.pyplot as plt
from mpl_finance import candlestick2_ohlc

#date format in data-> dd-mm-yyyy
nif = pd.read_csv('data.csv')   


#nif['Date'] = pd.to_datetime(nif['Date'], format='%d-%m-%Y', utc=True)

mavg = nif['Close'].ewm(span=50).mean()
mavg1 = nif['Close'].ewm(span=13).mean()

fg, ax1 = plt.subplots()

cl = candlestick2_ohlc(ax=ax1,opens=nif['Open'],highs=nif['High'],lows=nif['Low'],closes=nif['Close'],width=0.4, colorup='#77d879', colordown='#db3f3f')

mavg.plot(ax=ax1,label='50_ema')
mavg1.plot(color='k',ax=ax1, label='13_ema')

plt.legend(loc=4)
plt.subplots_adjust(left=0.09, bottom=0.20, right=0.94, top=0.90, wspace=0.2, hspace=0)
plt.show()

Output:

enter image description here

Palsy answered 28/5, 2018 at 4:38 Comment(1)
if my reply below helped you achieve what you needed, would appreciate if you accepted my answer..Tonneson
T
8

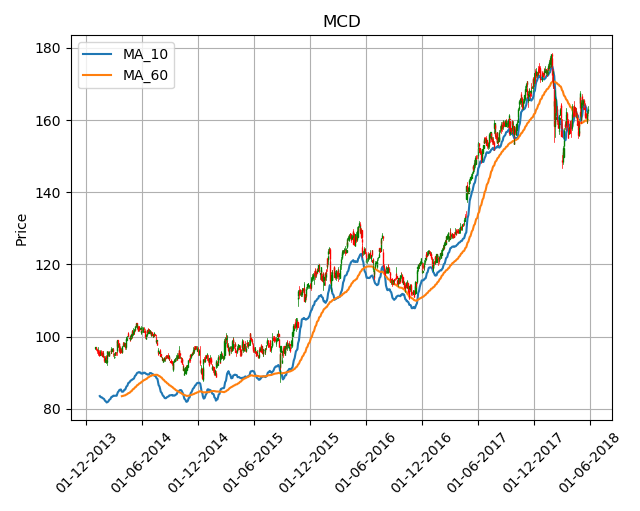
I also had a lot of "fun" with this in the past... Here is one way of doing it using mdates:

import pandas as pd
import pandas_datareader.data as web
import datetime as dt
import matplotlib.pyplot as plt
from matplotlib.finance import candlestick_ohlc
import matplotlib.dates as mdates

ticker = 'MCD'
start = dt.date(2014, 1, 1)

#Gathering the data
data = web.DataReader(ticker, 'yahoo', start)


#Calc moving average
data['MA10'] = data['Adj Close'].rolling(window=10).mean()
data['MA60'] = data['Adj Close'].rolling(window=60).mean()
data.reset_index(inplace=True)
data['Date']=mdates.date2num(data['Date'].astype(dt.date))

#Plot candlestick chart
fig = plt.figure()
ax1 = fig.add_subplot(111)
ax2 = fig.add_subplot(111)
ax3 = fig.add_subplot(111)
ax1.xaxis_date()
ax1.xaxis.set_major_formatter(mdates.DateFormatter('%d-%m-%Y'))
ax2.plot(data.Date, data['MA10'], label='MA_10')
ax3.plot(data.Date, data['MA60'], label='MA_60')
plt.ylabel("Price")
plt.title(ticker)
ax1.grid(True)
plt.legend(loc='best')
plt.xticks(rotation=45)
candlestick_ohlc(ax1, data.values, width=0.6, colorup='g', colordown='r')
plt.show()

Output:

enter image description here

Hope this helps.

Tonneson answered 28/5, 2018 at 5:52 Comment(0)
E
3

Simple df:

Assuming a simple df like this

Using plotly:

import plotly.figure_factory
fig = plotly.figure_factory.create_candlestick(df.open, df.high, df.low, df.close, dates=df.ts)
fig.show()

will automatically parse the ts column to be displayed correctly on x.

Ethelethelbert answered 3/10, 2019 at 22:4 Comment(0)
I
2

Clunky workaround here, derived from other post (if i can find again, will reference). Using a pandas df, plot by index and then reference xaxis tick labels to date strings for display. Am new to python / matplotlib, and this this solution is not so flexible, but it works basically. Also using a pd index for plotting removes the blank 'weekend' daily spaces on market price data. Matplotlib xaxis index as dates

import numpy as np
import pandas as pd
import matplotlib.pyplot as plt
from mpl_finance import candlestick2_ohlc
from mpl_finance import candlestick_ohlc

%matplotlib notebook # for Jupyter

# Format m/d/Y,Open,High,Low,Close,Adj Close,Volume
# csv data does not include NaN, or 'weekend' lines, 
# only dates from which prices are recorded
DJIA = pd.read_csv('yourFILE.csv') #Format m/d/Y,Open,High,
    Low,Close,Adj Close,Volume

print(DJIA.head())

fg, ax1 = plt.subplots()

cl =candlestick2_ohlc(ax=ax1,opens=DJIA['Open'],
    highs=DJIA['High'],lows=DJIA['Low'],
    closes=DJIA['Close'],width=0.4, colorup='#77d879', 
    colordown='#db3f3f')

ax1.set_xticks(np.arange(len(DJIA)))
ax1.set_xticklabels(DJIA['Date'], fontsize=6, rotation=-90)

plt.show()
Incisor answered 15/8, 2018 at 4:32 Comment(0)

© 2022 - 2024 — McMap. All rights reserved.