Add section to annotation chart?
Asked Answered
C

1

6

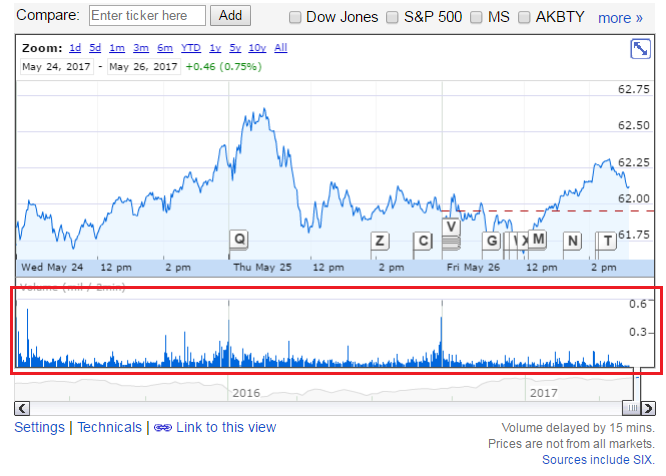
I'm using Google Charts' Annotation Chart to display data. Everything's working but it's not showing the volume section, as seen in this google finance chart that, I believe, uses the same chart.

Here's what I have so far, but I don't know how to include that section:

      google.charts.load('current', {'packages':['annotationchart']});
      google.charts.setOnLoadCallback(drawChart);

      function drawChart() {
        var data = new google.visualization.DataTable();
        data.addColumn('date', 'Date');
        data.addColumn('number', 'Col1');
        data.addColumn('string', 'Col2');
        data.addColumn('string', 'Col3');
        data.addColumn('number', 'Col4');
        data.addColumn('string', 'Col5');
        data.addColumn('string', 'Col6');
        data.addRows([
          [new Date(2017, 2, 15), 85, 'More', 'Even More',
                                  91, undefined, undefined],
          [new Date(2017, 2, 16), 93, 'Sales', 'First encounter',
                                  99, undefined, undefined],
          [new Date(2017, 2, 17), 75, 'Sales', 'Reached milestone',
                                  96, 'Att', 'Good'],
          [new Date(2017, 2, 18), 60, 'Sales', 'Low',
                                  80, 'HR', 'Absences'],
          [new Date(2017, 2, 19), 95, 'Sales', 'Goals',
                                  85, 'HR', 'Vacation'],
          [new Date(2017, 2, 20), 40, 'Sales', 'Training',
                                  67, 'HR', 'PTO']
        ]);

        var chart = new google.visualization.AnnotationChart(document.getElementById('chart_div'));

        var options = {
          displayAnnotations: true
        };

        chart.draw(data, options);
      }
	<script type="text/javascript" src="https://www.gstatic.com/charts/loader.js"></script>
	<div id='chart_div' style='width: 900px; height: 500px;'></div>

This is what the google finance chart looks like, but I can't seem to include the volume section marked in red: enter image description here
Caramelize answered 26/5, 2017 at 19:25 Comment(0)
M
1

the annotation chart does not include an option for the middle chart / volume section

this could be added manually by drawing another, separate chart

however, the second chart cannot be placed in between the annotation chart and it's range filter

as such, you would need to turn off the annotation's range filter
and draw your own ChartRangeFilter

typically, custom filters are bound to charts using a dashboard

however, while building the example for this answer,
i noticed the annotation chart doesn't re-draw properly

after the filter has been applied, and then removed,
the annotation chart does not return to the original state
to correct, need to create the annotation chart every time it is drawn

see following working snippet,

a column chart is used for the volume section

the range filter is bound manually using the 'statechange' event

google.charts.load('current', {
  callback: drawDashboard,
  packages: ['annotationchart', 'controls', 'corechart']
});

function drawDashboard() {
  var data = new google.visualization.DataTable();
  data.addColumn('date', 'Date');
  data.addColumn('number', 'Col1');
  data.addColumn('string', 'Col2');
  data.addColumn('string', 'Col3');
  data.addColumn('number', 'Col4');
  data.addColumn('string', 'Col5');
  data.addColumn('string', 'Col6');
  data.addRows([
    [new Date(2017, 2, 15), 85, 'More', 'Even More',
                            91, undefined, undefined],
    [new Date(2017, 2, 16), 93, 'Sales', 'First encounter',
                            99, undefined, undefined],
    [new Date(2017, 2, 17), 75, 'Sales', 'Reached milestone',
                            96, 'Att', 'Good'],
    [new Date(2017, 2, 18), 60, 'Sales', 'Low',
                            80, 'HR', 'Absences'],
    [new Date(2017, 2, 19), 95, 'Sales', 'Goals',
                            85, 'HR', 'Vacation'],
    [new Date(2017, 2, 20), 40, 'Sales', 'Training',
                            67, 'HR', 'PTO']
  ]);

  var rangeFilter = new google.visualization.ControlWrapper({
    controlType: 'ChartRangeFilter',
    containerId: 'control_div',
    dataTable: data,
    options: {
      filterColumnLabel: 'Date',
      ui: {
        chartOptions: {
          height: 60,
          width: '100%',
          chartArea: {
            width: '100%'
          },
          chartType: 'AreaChart'
        }
      }
    },
    view: {
      columns: [0, 1, 4]
    }
  });

  google.visualization.events.addListener(rangeFilter, 'ready', drawCharts);
  google.visualization.events.addListener(rangeFilter, 'statechange', drawCharts);

  rangeFilter.draw();

  function drawCharts() {
    var filterState = rangeFilter.getState();
    var filterRows = data.getFilteredRows([{
      column: 0,
      minValue: filterState.range.start,
      maxValue: filterState.range.end
    }]);
    var viewAnn = new google.visualization.DataView(data);
    viewAnn.setRows(filterRows);

    var chartAnn = new google.visualization.AnnotationChart(document.getElementById('chart_ann'));
    var optionsAnn = {
      displayAnnotations: false,
      displayRangeSelector: false
    };
    chartAnn.draw(viewAnn, optionsAnn);

    var viewCol = new google.visualization.DataView(data);
    viewCol.setColumns([0, 1, 4]);
    viewCol.setRows(filterRows);

    var chartCol = new google.visualization.ColumnChart(document.getElementById('chart_col'));
    var optionsCol = {
      hAxis: {
        textStyle: {
          color: 'transparent'
        }
      },
      height: 72,
      legend: 'none',
      theme: 'maximized',
      vAxis: {
        textStyle: {
          color: 'transparent'
        }
      }
    };
    chartCol.draw(viewCol, optionsCol);
  }
}
<script src="https://www.gstatic.com/charts/loader.js"></script>
<div id="chart_ann"></div>
<div id="chart_col"></div>
<div id="control_div"></div>
Mccormac answered 31/5, 2017 at 19:58 Comment(4)
Thanks for the help. The chart looks better now, but it seems that the annotations are gone.Caramelize
if you're referring to the annotation table on the right side of the chart, remove following option from chart --> displayAnnotations: false -- didn't see the table in the posted image, wasn't sure...Mccormac
Thanks. I did find a bug: if I move the right slider to Mar 18 and the left slider to mar 17 or more to the right, the chart will display message Table has no rows several times. I assume this is a way to debug the chart, but I don't know where that code is.Caramelize
that is the result when the filter excludes all data, you can listen for the 'error' event, similar to 'ready' or 'statechange' events above, then use removeError method to show your own or simply suppress -- here is an exampleMccormac

© 2022 - 2024 — McMap. All rights reserved.