How to analyze golang memory?
Asked Answered
L

7

122

I wrote a golang program, that uses 1.2GB of memory at runtime.

Calling go tool pprof http://10.10.58.118:8601/debug/pprof/heap results in a dump with only 323.4MB heap usage.

  • What's about the rest of the memory usage?
  • Is there any better tool to explain golang runtime memory?

Using gcvis I get this:

enter image description here

.. and this heap form profile:

enter image description here

Here is my code: https://github.com/sharewind/push-server/blob/v3/broker

Laboured answered 21/7, 2014 at 10:43 Comment(4)
Post your code. Tell us what your program does.Cyprus
Maybe because of a gc? dave.cheney.net/2014/07/11/visualising-the-go-garbage-collector could help.Thermodynamic
It looks like the remaning memory is not garbaged collected and release to the system. It is done after a few minutes of inactivity. Wait 8 minutes and check again. Check this link for a guide of how to debug/profile Go programs: software.intel.com/en-us/blogs/2014/05/10/…Jeffreyjeffreys
See also runtime.MemStats explained at golang.org/pkg/runtime/#MemStatsClearness
N
92

The heap profile shows active memory, memory the runtime believes is in use by the go program (ie: hasn't been collected by the garbage collector). When the GC does collect memory the profile shrinks, but no memory is returned to the system. Your future allocations will try to use memory from the pool of previously collected objects before asking the system for more.

From the outside, this means that your program's memory use will either be increasing, or staying level. What the outside system presents as the "Resident Size" of your program is the number of bytes of RAM is assigned to your program whether it's holding in-use go values or collected ones.

The reason why these two numbers are often quite different are because:

  1. The GC collecting memory has no effect on the outside view of the program
  2. Memory fragmentation
  3. The GC only runs when the memory in use doubles the memory in use after the previous GC (by default, see: http://golang.org/pkg/runtime/#pkg-overview)

If you want an accurate breakdown of how Go sees the memory you can use the runtime.ReadMemStats call: http://golang.org/pkg/runtime/#ReadMemStats

Alternatively, since you are using web-based profiling if you can access the profiling data through your browser at: http://10.10.58.118:8601/debug/pprof/ , clicking the heap link will show you the debugging view of the heap profile, which has a printout of a runtime.MemStats structure at the bottom.

The runtime.MemStats documentation (http://golang.org/pkg/runtime/#MemStats) has the explanation of all the fields, but the interesting ones for this discussion are:

  • HeapAlloc: essentially what the profiler is giving you (active heap memory)
  • Alloc: similar to HeapAlloc, but for all go managed memory
  • Sys: the total amount of memory (address space) requested from the OS

There will still be discrepancies between Sys, and what the OS reports because what Go asks of the system, and what the OS gives it are not always the same. Also CGO / syscall (eg: malloc / mmap) memory is not tracked by go.

Neighborhood answered 21/7, 2014 at 12:50 Comment(4)
I'm using go 1.3.3 and web-based profiling however /debug/pprof/heap does not contain a printout of the runtime.MemStats structLehet
"No memory is returned to the system" is not entirely accurate now. See godoc runtime/debug #FreeOSMemory().Ripe
This might have been different in the past, but according to the current docs on runtime.MemStats, Alloc and HeapAlloc have the same meaning.Universally
what does it mean when Sys is more than Resident memory? In my case, Alloc is 778MB, Sys is 2326MB and Resident memory is 498MB. I can understand if Resident memory is more than Sys value as that means OS didn't give all what program requested. But opposite scenario is not explainable.Hobgoblin
U
41

As an addition to @Cookie of Nine's answer, in short: you can try the --alloc_space option.

go tool pprof use --inuse_space by default. It samples memory usage so the result is subset of real one.
By --alloc_space pprof returns all alloced memory since program started.

Uela answered 22/7, 2014 at 8:47 Comment(1)
--alloc_space is exactly what I was looking for.Eryn
C
33

UPD (2022)

For those who knows Russian, I made a presentation and wrote couple of articles on this topic:

  1. RAM consumption in Golang: problems and solutions (Потребление оперативной памяти в языке Go: проблемы и пути решения)
  2. Preventing Memory Leaks in Go, Part 1. Business Logic Errors (Предотвращаем утечки памяти в Go, ч. 1. Ошибки бизнес-логики)
  3. Preventing memory leaks in Go, part 2. Runtime features (Предотвращаем утечки памяти в Go, ч. 2. Особенности рантайма)

Original answer (2017)

I was always confused about the growing residential memory of my Go applications, and finally I had to learn the profiling tools that are present in Go ecosystem. Runtime provides many metrics within a runtime.Memstats structure, but it may be hard to understand which of them can help to find out the reasons of memory growth, so some additional tools are needed.

Profiling environment

Use https://github.com/tevjef/go-runtime-metrics in your application. For instance, you can put this in your main:

import(
    metrics "github.com/tevjef/go-runtime-metrics"
)
func main() {
    //...
    metrics.DefaultConfig.CollectionInterval = time.Second
    if err := metrics.RunCollector(metrics.DefaultConfig); err != nil {
        // handle error
    }
}

Run InfluxDB and Grafana within Docker containers:

docker run --name influxdb -d -p 8086:8086 influxdb
docker run -d -p 9090:3000/tcp --link influxdb --name=grafana grafana/grafana:4.1.0

Set up interaction between Grafana and InfluxDB Grafana (Grafana main page -> Top left corner -> Datasources -> Add new datasource):

enter image description here

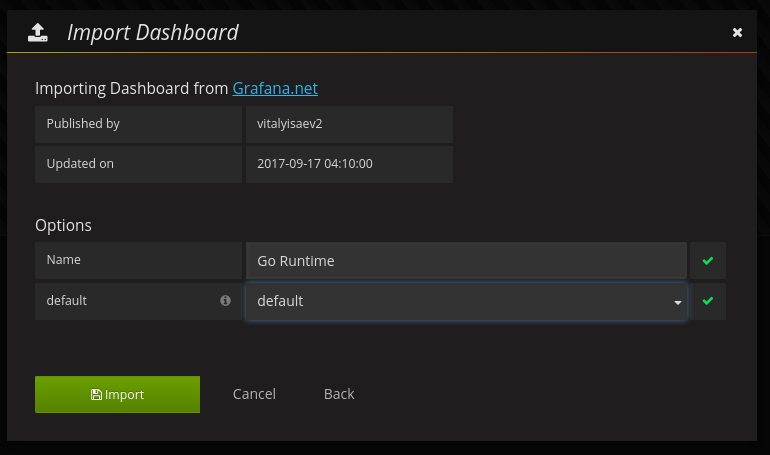
Import dashboard #3242 from https://grafana.com (Grafana main page -> Top left corner -> Dashboard -> Import):

enter image description here

Finally, launch your application: it will transmit runtime metrics to the contenerized Influxdb. Put your application under a reasonable load (in my case it was quite small - 5 RPS for a several hours).

Memory consumption analysis

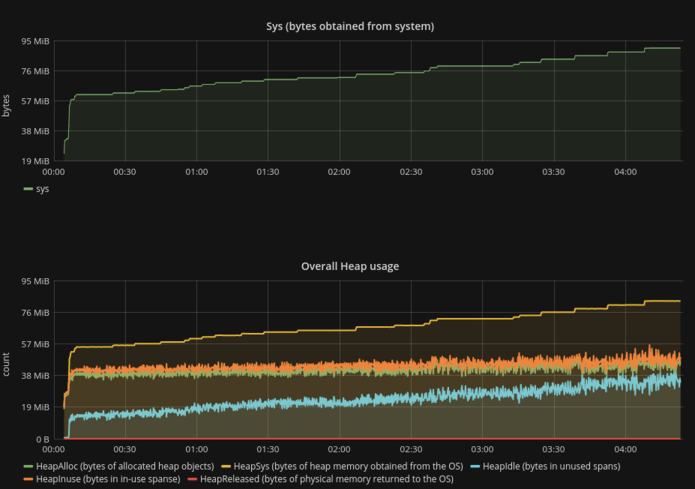
  1. Sys (the synonim of RSS) curve is quite similar to HeapSys curve. Turns out that dynamic memory allocation was the main factor of overall memory growth, so the small amount of memory consumed by stack variables seem to be constant and can be ignored;
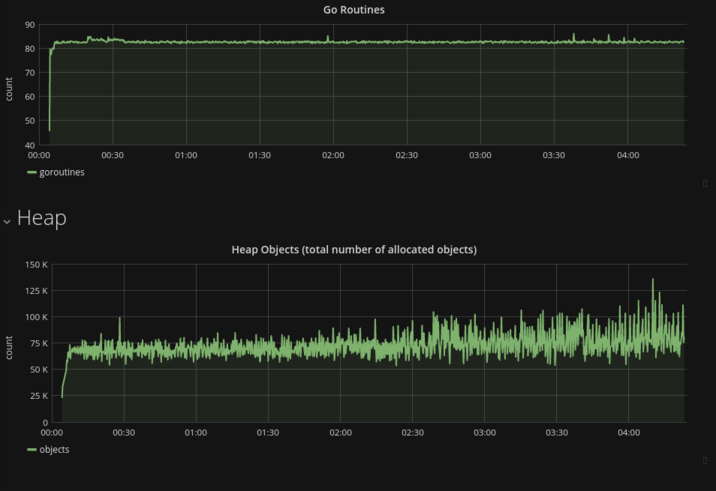
  2. The constant amount of goroutines garantees the absence of goroutine leaks / stack variables leak;
  3. The total amount of allocated objects remains the same (there is no point in taking into account the fluctuations) during the lifetime of the process.
  4. The most surprising fact: HeapIdle is growing with the same rate as a Sys, while HeapReleased is always zero. Obviously runtime doesn't return memory to OS at all , at least under the conditions of this test:
HeapIdle minus HeapReleased estimates the amount of memory    
that could be returned to the OS, but is being retained by
the runtime so it can grow the heap without requesting more
memory from the OS.

enter image description hereenter image description here

For those who's trying to investigate the problem of memory consumption I would recommend to follow the described steps in order to exclude some trivial errors (like goroutine leak).

Freeing memory explicitly

It's interesting that the one can significantly decrease memory consumption with explicit calls to debug.FreeOSMemory():

// in the top-level package
func init() {
   go func() {
       t := time.Tick(time.Second)
       for {
           <-t
           debug.FreeOSMemory()
       }
   }()
}

comparison

In fact, this approach saved about 35% of memory as compared with default conditions.

Celesta answered 17/9, 2017 at 2:21 Comment(1)
Great writeup. Unfortunately InfluxDB has moved on to not supporting Create DB. The referenced library fails at the create DB stepBuddie
S
10

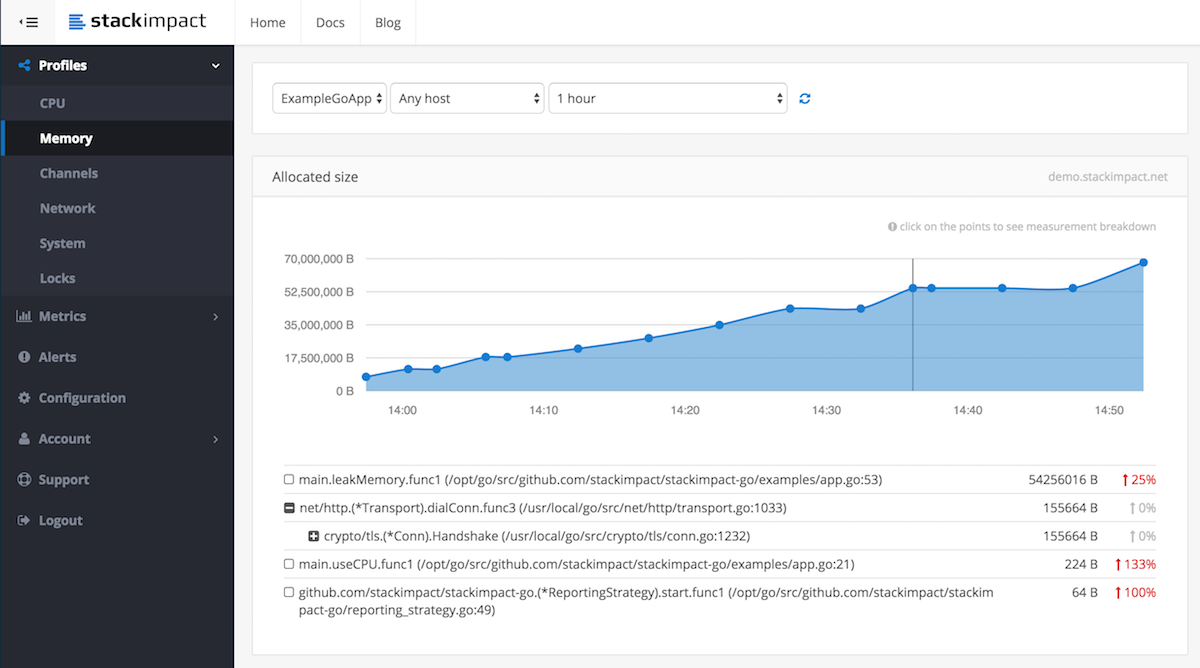
You can also use StackImpact, which automatically records and reports regular and anomaly-triggered memory allocation profiles to the dashboard, which are available in a historical and comparable form. See this blog post for more details Memory Leak Detection in Production Go Applications

enter image description here

Disclaimer: I work for StackImpact

Sundown answered 14/10, 2016 at 13:21 Comment(2)
I have tried StackImpact, and memory leaks grown tremendously. One of memory leak point pastebin.com/ZAPCeGmpEboat
It looks like you're using --alloc_space, which is not suitable for memory leak detection. It will just show you how much memory was allocated since the program start. For a long running program the numbers can get pretty high. We are not aware of any memory leaks in the StackImpact agent so far.Sundown
K
1

Attempting to answer the following original question

Is there any better tool to explain golang runtime memory?

I find the following tools useful

Statsview https://github.com/go-echarts/statsview Statsview is integrated the standard net/http/pprof

Statsviz https://github.com/arl/statsviz

Kingmaker answered 27/4, 2022 at 0:39 Comment(0)
S
1

This article will be pretty much helpful for your problem.

https://medium.com/safetycultureengineering/analyzing-and-improving-memory-usage-in-go-46be8c3be0a8

I ran a pprof analysis. pprof is a tool that’s baked into the Go language that allows for analysis and visualisation of profiling data collected from a running application. It’s a very helpful tool that collects data from a running Go application and is a great starting point for performance analysis. I’d recommend running pprof in production so you get a realistic sample of what your customers are doing.

When you run pprof you’ll get some files that focus on goroutines, CPU, memory usage and some other things according to your configuration. We’re going to focus on the heap file to dig into memory and GC stats. I like to view pprof in the browser because I find it easier to find actionable data points. You can do that with the below command.

go tool pprof -http=:8080 profile_name-heap.pb.gz

pprof has a CLI tool as well, but I prefer the browser option because I find it easier to navigate. My personal recommendation is to use the flame graph. I find that it’s the easiest visualiser to make sense of, so I use that view most of the time. The flame graph is a visual version of a function’s stack trace. The function at the top is the called function, and everything underneath it is called during the execution of that function. You can click on individual function calls to zoom in on them which changes the view. This lets you dig deeper into the execution of a specific function, which is really helpful. Note that the flame graph shows the functions that consume the most resources so some functions won’t be there. This makes it easier to figure out where the biggest bottlenecks are.

Is this helpful?

Stortz answered 25/10, 2022 at 9:15 Comment(1)
Thanks for adding some suggestions, but this doesn't add much. The OP is clearly familiar with pprof, and their question relates to why there is a disparity between total memory usage versus that reported by pprof heap.Messily
C
1

Try GO plugin for Tracy. Tracy is "A real time, nanosecond resolution, remote telemetry" (...). GoTracy (name of the plugin) is the agent with connect with the Tracy and send necessary information to better understand your app process. After importing plugin You can put telemetry code like in description below:

func exampleFunction() {
    gotracy.TracyInit()
    gotracy.TracySetThreadName("exampleFunction")
    for i := 0.0; i < math.Pi; i += 0.1 {

        zoneid := gotracy.TracyZoneBegin("Calculating Sin(x) Zone", 0xF0F0F0)
        gotracy.TracyFrameMarkStart("Calculating sin(x)")
        sin := math.Sin(i)
        gotracy.TracyFrameMarkEnd("Calculating sin(x)")
        gotracy.TracyMessageLC("Sin(x) = "+strconv.FormatFloat(sin, 'E', -1, 64), 0xFF0F0F)
        gotracy.TracyPlotDouble("sin(x)", sin)
        gotracy.TracyZoneEnd(zoneid)

        gotracy.TracyFrameMark()
    }
}

The result of is similar to: enter image description here

The plugin is placed in: https://github.com/grzesl/gotracy

The Tracy is placed in: https://github.com/wolfpld/tracy

Carcanet answered 22/11, 2022 at 19:1 Comment(0)

© 2022 - 2024 — McMap. All rights reserved.