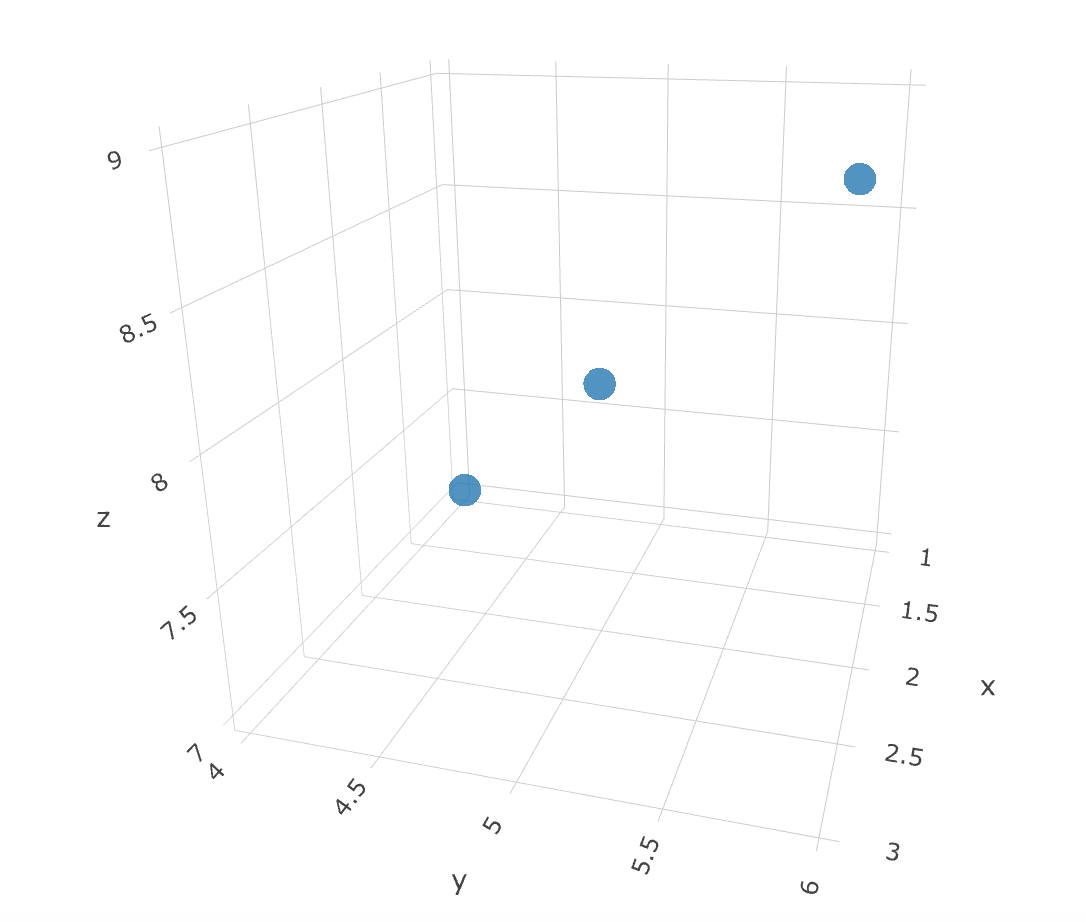
I use Jupyter Notebook to make analysis of datasets. There are a lot of plots in the notebook, and some of them are 3d plots.
I'm wondering if it is possible to make the 3d plot interactive, so I can later play with it in more details?
Maybe we can add a button on it? Clicking it can pop out a 3d plot and people can zoom, pan, rotate etc.
My thougths:
1. matplotlib, %qt
This does not fit my case, because I need to continue plot after the 3d plot. %qt will interfere with later plots.
2. mpld3
mpld3 is almost ideal in my case, no need to rewrite anything, compatible with matplotlib. However, it only support 2D plot. And I didn't see any plan working on 3D (https://github.com/mpld3/mpld3/issues/223).
3. bokeh + visjs
Didn't find any actualy example of 3d plot in bokeh gallery. I only find https://demo.bokeh.org/surface3d, which uses visjs.
4. Javascript 3D plot?
Since what I need is just line and surce, is it possible to pass the data to js plot using js in the browser to make it interacive? (Then we may need to add 3d axis as well.) This may be similar to visjs, and mpld3.


%matplotlib notebook– Heroineinlineandnotebookin one jupyter notebook? – Gionotebook; just rewrote the comment as an answer to make it easier for others to find. – Heroine