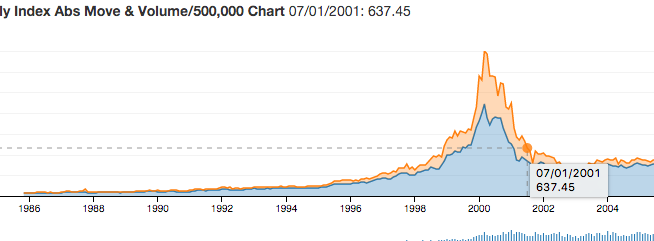
I'm looking to create a stacked line graph similar to the following example:
https://dc-js.github.io/dc.js/
However, in addition I would like a field above the graph that displays the current value of the mouseover.
I.e. instead of having to pause for a second with the cursor on the graph, and then having a mouse over box come up, I would like the values to show outside the graph, similar to the way that they do in Google Finance (see how price and vol on top left of graph change as you mouseover). E.g.https://www.google.com/finance?q=apple&ei=MUiWVtnQIdaP0ASy-6Uo
I would really appreciate any info the community could share on what is the best way to approach this.

