Color a column by another column's value
Asked Answered
U

2

6

I would like to create a gt table where I display numeric values from two columns together in a single cell, but color the cells based on just one of the column's values.

For example using the ToothGrowth example data I'd like to put the len and dose columns together in a single cell but color the cell backgrounds by the value of dose.

I tried to manually create a vector of colors to color the len_dose column but this does not work because it seems like it is reapplying the color vector to each different level of len_dose, not dose. I guess you could manually format the cells with tab_style() but that seems inefficient and does not give you the nice feature where the text color changes to maximize contrast with background. I don't know an efficient way to do this.

What I tried:

library(gt)
library(dplyr)
library(scales)
library(glue)

# Manually map dose to color
dose_colors <- col_numeric(palette = 'Reds', domain = range(ToothGrowth$dose))(ToothGrowth$dose)

ToothGrowth %>%
  mutate(len_dose = glue('{len}: ({dose})')) %>%
  gt(rowname_col = 'supp') %>%
  cols_hide(c(len, dose)) %>%
  data_color(len_dose, colors = dose_colors)  

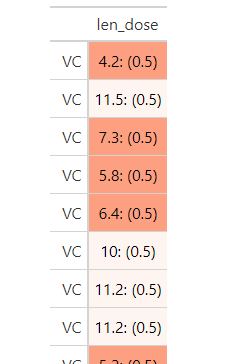
Output (not good because not colored by dose):

enter image description here

Underpass answered 27/5, 2021 at 13:7 Comment(1)
This has now been implemented in gt - see github.com/rstudio/gt/issues/1103 - so the best solution is just to use their new data_color() function.Boigie
B
5

Update Feb 2023

The option to color based on another column has now been added to the gt package - data_color() has gained a taregt_columns argument. So this has become much simpler:

library(gt)
library(dplyr)

ToothGrowth %>%
  mutate(len_dose = glue('{len}: ({dose})')) %>%
  gt(rowname_col = 'supp') %>%
  cols_hide(c(len, dose)) %>%
  data_color(columns = "dose", target_columns = "len_dose",
             palette = "ggsci::green_material")

Outdated

I faced the same issue and adjusted the gt::data_color function to accept separate source and target columns - with that, the following should work to produce your desired output.

# Distinguish SOURCE_columns and TARGET_columns

my_data_color <- function (data, SOURCE_columns, TARGET_columns, colors, alpha = NULL, apply_to = c("fill", 
                                                                                                    "text"), autocolor_text = TRUE) 
{
  stop_if_not_gt(data = data)
  apply_to <- match.arg(apply_to)
  colors <- rlang::enquo(colors)
  data_tbl <- dt_data_get(data = data)
  colors <- rlang::eval_tidy(colors, data_tbl)
  resolved_source_columns <- resolve_cols_c(expr = {
    {
      SOURCE_columns
    }
  }, data = data)
  resolved_target_columns <- resolve_cols_c(expr = {
    {
      TARGET_columns
    }
  }, data = data)
  rows <- seq_len(nrow(data_tbl))
  data_color_styles_tbl <- dplyr::tibble(locname = character(0), 
                                         grpname = character(0), colname = character(0), locnum = numeric(0), 
                                         rownum = integer(0), colnum = integer(0), styles = list())
  for (i in seq_along(resolved_source_columns)) {
    data_vals <- data_tbl[[resolved_source_columns[i]]][rows]
    if (inherits(colors, "character")) {
      if (is.numeric(data_vals)) {
        color_fn <- scales::col_numeric(palette = colors, 
                                        domain = data_vals, alpha = TRUE)
      }
      else if (is.character(data_vals) || is.factor(data_vals)) {
        if (length(colors) > 1) {
          nlvl <- if (is.factor(data_vals)) {
            nlevels(data_vals)
          }
          else {
            nlevels(factor(data_vals))
          }
          if (length(colors) > nlvl) {
            colors <- colors[seq_len(nlvl)]
          }
        }
        color_fn <- scales::col_factor(palette = colors, 
                                       domain = data_vals, alpha = TRUE)
      }
      else {
        cli::cli_abort("Don't know how to map colors to a column of class {class(data_vals)[1]}.")
      }
    }
    else if (inherits(colors, "function")) {
      color_fn <- colors
    }
    else {
      cli::cli_abort("The `colors` arg must be either a character vector of colors or a function.")
    }
    color_fn <- rlang::eval_tidy(color_fn, data_tbl)
    color_vals <- color_fn(data_vals)
    color_vals <- html_color(colors = color_vals, alpha = alpha)
    color_styles <- switch(apply_to, fill = lapply(color_vals, 
                                                   FUN = function(x) cell_fill(color = x)), text = lapply(color_vals, 
                                                                                                          FUN = function(x) cell_text(color = x)))
    data_color_styles_tbl <- dplyr::bind_rows(data_color_styles_tbl, 
                                              generate_data_color_styles_tbl(column = resolved_target_columns[i], rows = rows, 
                                                                             color_styles = color_styles))
    if (apply_to == "fill" && autocolor_text) {
      color_vals <- ideal_fgnd_color(bgnd_color = color_vals)
      color_styles <- lapply(color_vals, FUN = function(x) cell_text(color = x))
      data_color_styles_tbl <- dplyr::bind_rows(data_color_styles_tbl, 
                                                generate_data_color_styles_tbl(column = resolved_target_columns[i], 
                                                                               rows = rows, color_styles = color_styles))
    }
  }
  dt_styles_set(data = data, styles = dplyr::bind_rows(dt_styles_get(data = data), 
                                                       data_color_styles_tbl))
}


# Add function into gt namespace (so that internal gt functions can be called)
library(gt)
tmpfun <- get("data_color", envir = asNamespace("gt"))
environment(my_data_color) <- environment(tmpfun)

library(dplyr)
#> 
#> Attaching package: 'dplyr'
#> The following objects are masked from 'package:stats':
#> 
#>     filter, lag
#> The following objects are masked from 'package:base':
#> 
#>     intersect, setdiff, setequal, union
library(glue)

# Map dose to color
ToothGrowth %>%
  mutate(len_dose = glue('{len}: ({dose})')) %>%
  gt(rowname_col = 'supp') %>%
  cols_hide(c(len, dose)) %>%
  my_data_color(SOURCE_columns = "dose", TARGET_columns = "len_dose", 
             colors = scales::col_numeric(palette = c("red", "green"), domain = c(min(ToothGrowth$dose), max(ToothGrowth$dose))))  

Created on 2022-11-03 with reprex v2.0.2

Boigie answered 3/11, 2022 at 12:1 Comment(4)
This is great, you should consider submitting a pull request to gtUnderpass
Thanks! I suggested this to gt, but I don't think it is quite in line with their interface ...Boigie
This has now been implemented in gt - see github.com/rstudio/gt/issues/1103 - so the best solution is just to use their new data_color() function.Boigie
thank you for letting me & everyone know! Would you consider updating this accepted answer to reflect the new version of gt's data_color()?Underpass
A
4

Not sure if you found a solution to this yet but here is what I did:

  • If you use tab_style() you don't need to try and create the vector of colors and can instead set the background color you want based on the dose column. If you want to color values differently based on dose, in addition to what I've colored here, then create another tab_style() for the desired value.

    library(gt)
     library(dplyr)
     library(scales)
     library(glue)
    
     ToothGrowth %>%
       mutate(len_dose = glue('{len}: ({dose})')) %>%
       gt(rowname_col = 'supp') %>%
       tab_style(
         style = cell_fill(color = "palegreen"),
         location = cells_body(
           columns = len_dose,
           rows = dose >= 1.0
         )
       ) %>%
       cols_hide(c(len, dose))
    

enter image description here

Anderaanderea answered 10/6, 2022 at 1:12 Comment(3)
This looks great! The only disappointing thing is I guess you still need to call tab_style multiple times if you want to have more than two different background values. With this solution, there's still no way to do it with a continuous value as you can with data_color, correct?Underpass
You could do use & or | like this ToothGrowth %>% mutate(len_dose = glue('{len}: ({dose})')) %>% gt(rowname_col = 'supp') %>% tab_style( style = cell_fill(color = "palegreen"), location = cells_body( columns = len_dose, rows = dose > 1.0 | dose < 1.0 ) ) %>% cols_hide(c(len, dose))Anderaanderea
But that would still require a different call to tab_style for each additional background color you wanted to add, right? As I stated in the original question, adding colors one at a time with tab_style is not really efficient if you have a continuous-valued column that you want to use to color a different column. So I will hold off on accepting your answer for now, thanks again for your help.Underpass

© 2022 - 2024 — McMap. All rights reserved.