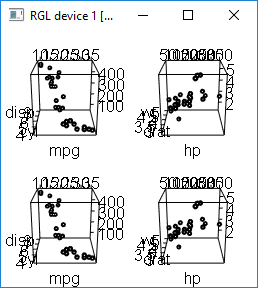
I am trying to get two 3D scatter plots, drawn with the rgl package, side-by-side in an R Markdown document. For example:
mfrow3d(nr = 1, nc = 2, sharedMouse = TRUE)
plot3d(mtcars[, 1:3], type = "s")
plot3d(mtcars[, 4:6], type = "s")
rglwidget()
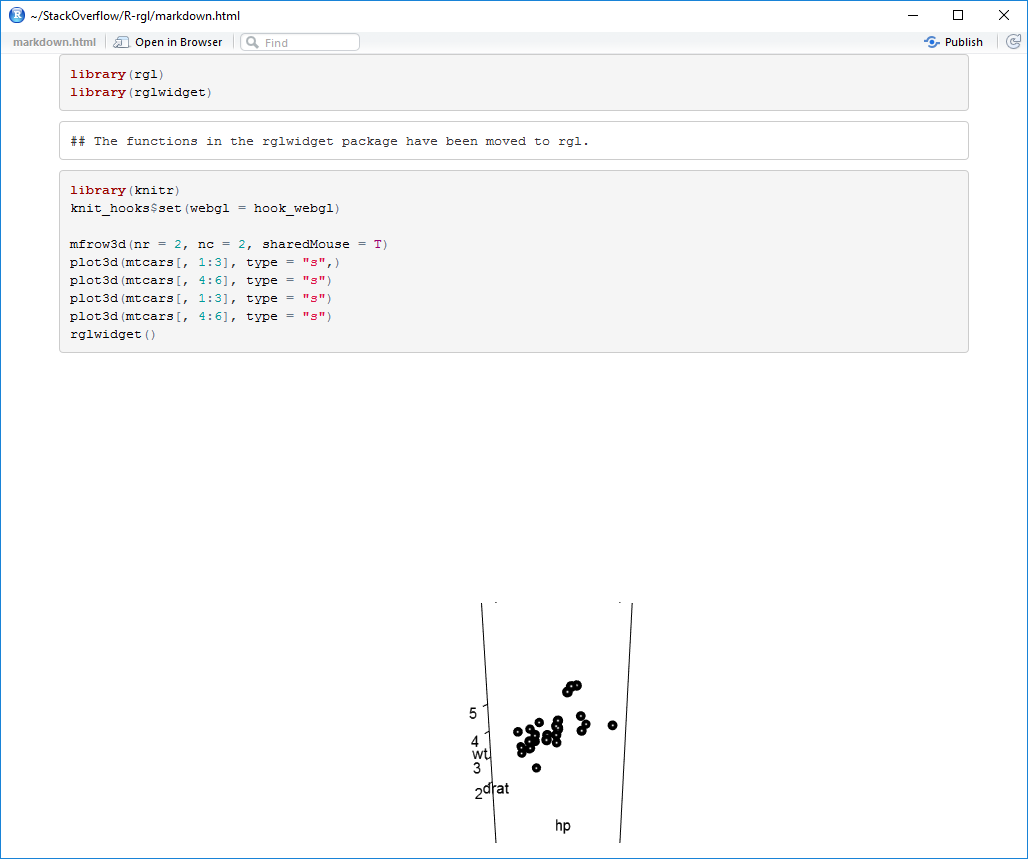
This works perfectly when run directly in the console but when knit to an HTML document using R Markdown, it seems as if only the second plot is rendered.
I tried adding knit_hooks$set(webgl = hook_webgl) and setting the chunk option webgl = TRUE, but that did not help either.
Any suggestions would be appreciated.
This is my output from sessionInfo():
R version 3.3.1 (2016-06-21)
Platform: x86_64-w64-mingw32/x64 (64-bit)
Running under: Windows >= 8 x64 (build 9200)

locale:
[1] LC_COLLATE=English_United States.1252  LC_CTYPE=English_United States.1252
[3] LC_MONETARY=English_United States.1252 LC_NUMERIC=C
[5] LC_TIME=English_United States.1252

attached base packages:
[1] stats     graphics  grDevices utils     datasets  methods   base

other attached packages:
 [1] rgl_0.96.0           tidyr_0.6.0          dplyr_0.5.0          smacof_1.8-13
 [5] emojifont_0.3.3      gridExtra_2.2.1      knitr_1.14           MASS_7.3-45
 [9] shinydashboard_0.5.1 shiny_0.13.2         RColorBrewer_1.1-2   ggplot2_2.1.0

loaded via a namespace (and not attached):
 [1] gtools_3.5.0        splines_3.3.1       lattice_0.20-33     colorspace_1.2-6
 [5] htmltools_0.3.5     yaml_2.1.13         base64enc_0.1-3     chron_2.3-47
 [9] survival_2.39-4     DBI_0.5             foreign_0.8-66      plyr_1.8.4
[13] stringr_1.1.0       munsell_0.4.3       gtable_0.2.0        htmlwidgets_0.7
[17] evaluate_0.9        latticeExtra_0.6-28 httpuv_1.3.3        proto_0.3-10
[21] Rcpp_0.12.6         acepack_1.3-3.3     xtable_1.8-2        polynom_1.3-8
[25] scales_0.4.0        formatR_1.4         showtext_0.4-4      gdata_2.17.0
[29] jsonlite_1.0        Hmisc_3.17-4        sysfonts_0.5        mime_0.5
[33] weights_0.85        digest_0.6.10       stringi_1.1.1       showtextdb_1.0
[37] grid_3.3.1          tools_3.3.1         magrittr_1.5        tibble_1.2
[41] Formula_1.2-1       mice_2.25           cluster_2.0.4       Matrix_1.2-6
[45] rsconnect_0.4.3     data.table_1.9.6    nnls_1.4            assertthat_0.1
[49] rmarkdown_1.0.9013  R6_2.1.3            rpart_4.1-10        nnet_7.3-12


