My pandas data frame has two columns: category and duration. And
I use the following code to make a box plot of all data points.
import matplotlib.pyplot as plt
plt.boxplot(df.duration)
plt.show()
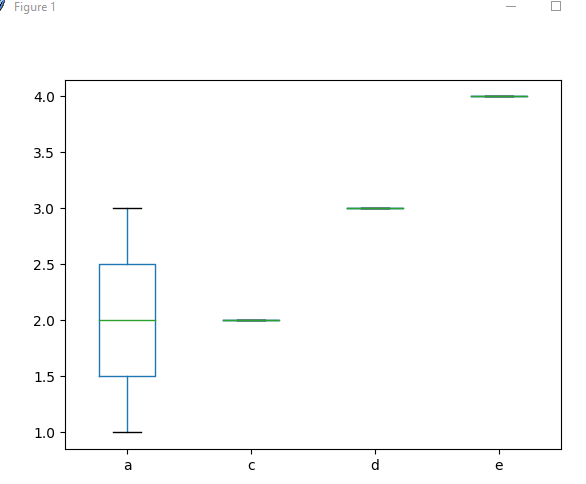
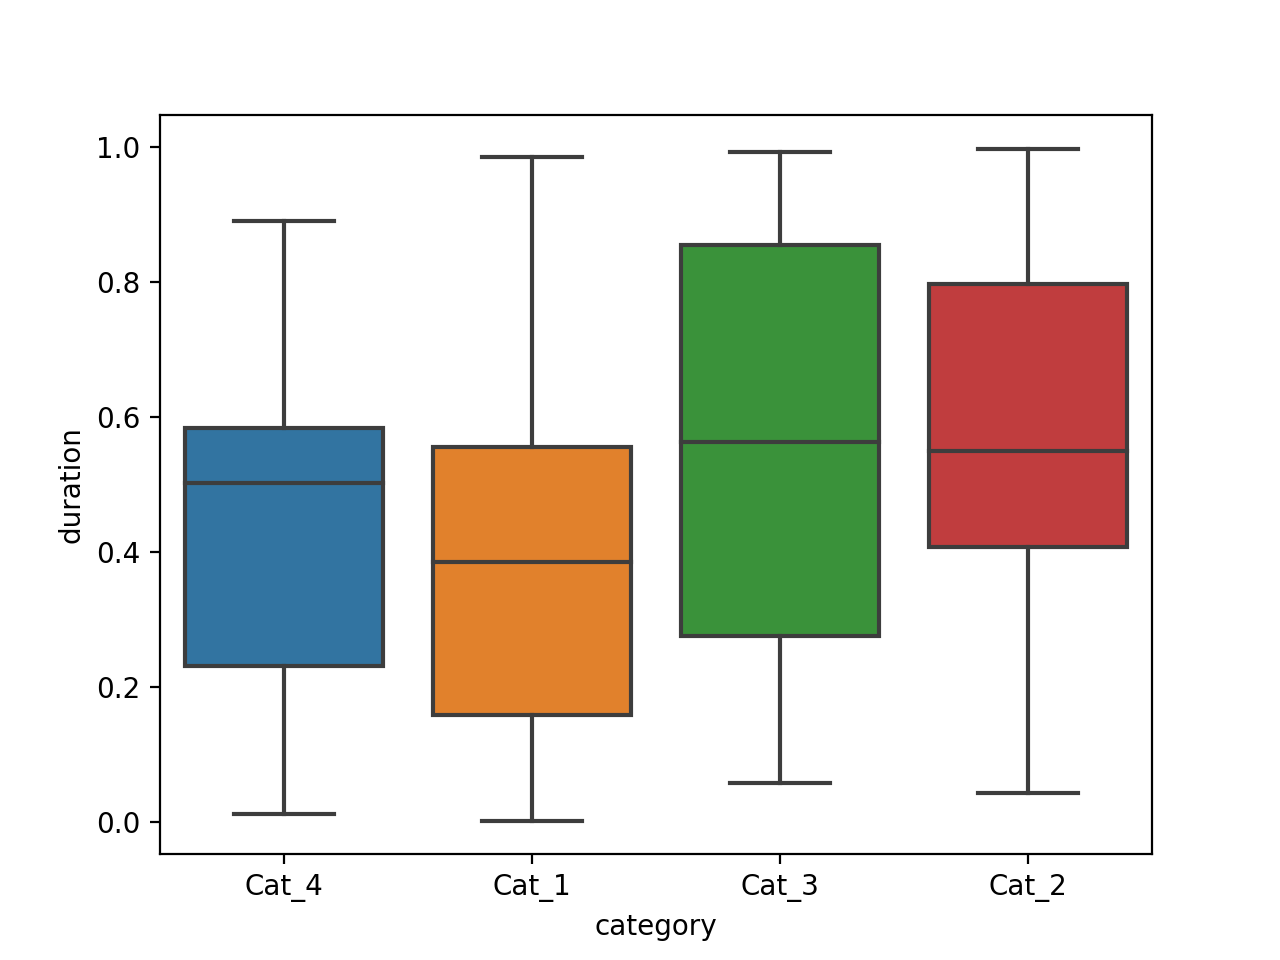
However, if I want one box fore each category, how do I modify the above code? Thanks!


