Automatically save Tensorboard-like plot of loss to image file
Asked Answered
S

2

6

I am currently trying to predict the movement of a particle using a tensorflow premade Estimator (tf.estimator.DNNRegressor).

I want to save an image of the average loss plot, like the one tensorboard displays, into each model's folder.Image from tensorboard
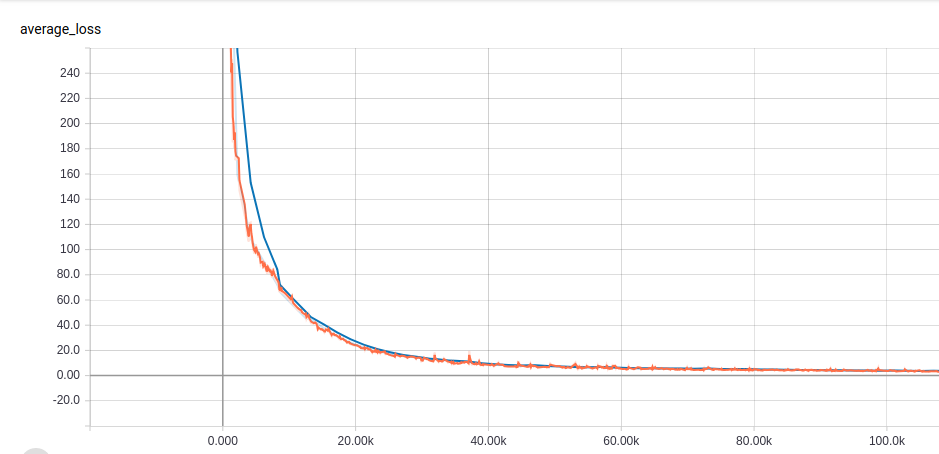
Tensorboard is pretty good to monitor this during training, but I want to save an image for future reference (e.g. comparing different approaches visually)

Is there an easy way to do this? I could save the results of the evaluation at different times and use matplotlib, but I haven't found anything on how to get the loss from the regressor.train method.

Solan answered 28/6, 2018 at 9:31 Comment(2)
Not actual solutions, but alternatives. 1) You can download the data in JSON/CSV (check "Show data download links" in upper-left corner) and plot it with Excel/Pandas/etc. 2) Someone wrote exportTensorFlowLog to solve this problem (didn't test it myself) 3) Browser developer tools let you to take screenshots of specific elements (e.g. Chrome, Firefox)Statist
exportTensorFlowLog works well for me - I'd recommend itSolan
R
10

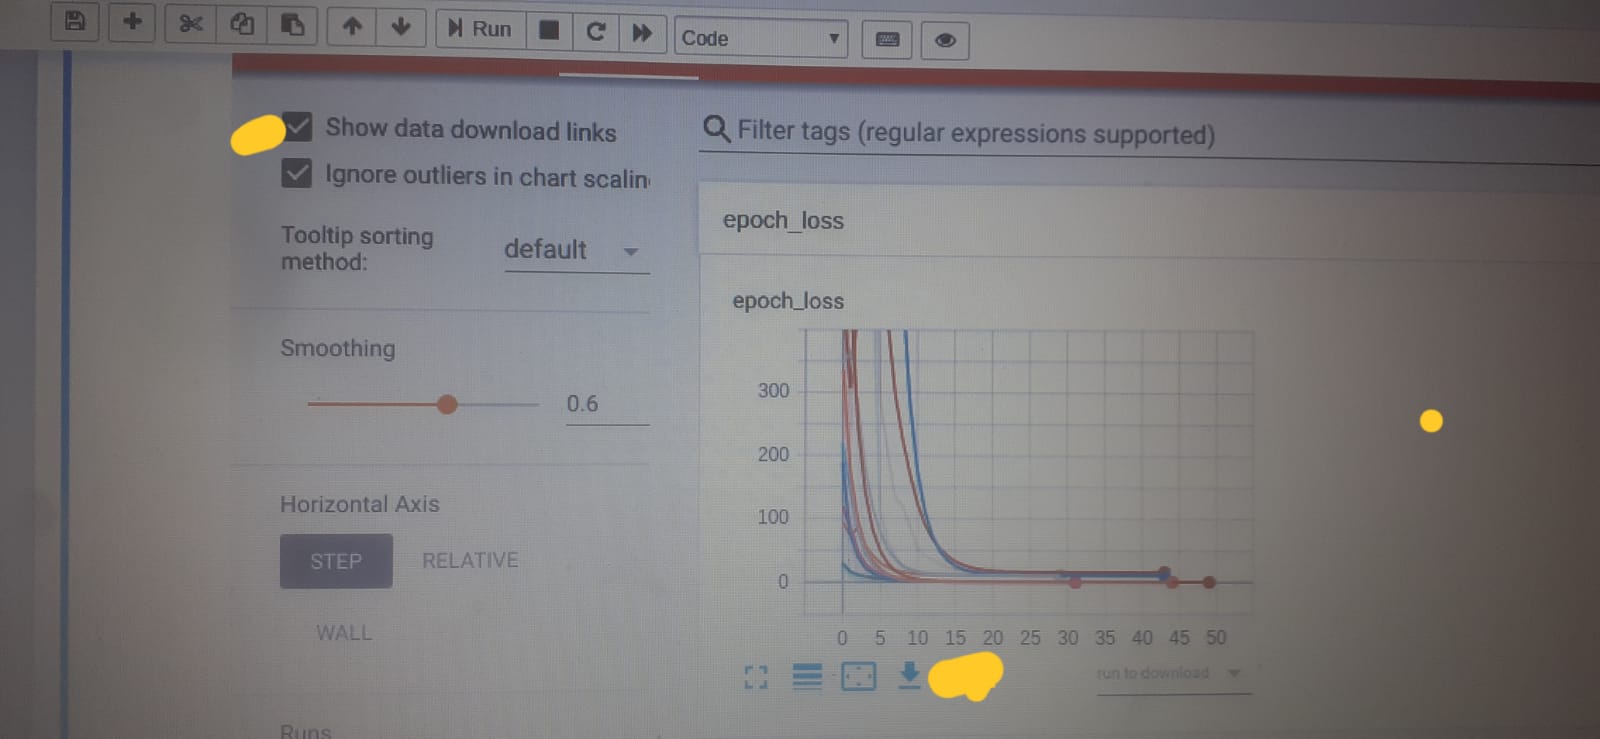
Yes, currently, you can download the .svg of loss/other_metric history as @Jdehesa pointed out in the comment:

  1. Check Show data download links;

  2. You can see a download symbol on the bottom of the figure;

  3. See the yellow marks in the figure if you can't locate them.

image

Remsen answered 24/5, 2020 at 14:26 Comment(0)
Y
3

If you would like to do it programmatically, you could combine the CSVLogger and a custom callback for plotting:

class CustomCallbackPlot(Callback):

def __init__(self, training_data_dir):
    self.tdr = training_data_dir

def on_epoch_end(self, epoch, logs=None):
    df_loan = pd.read_csv(os.path.join(self.tdr, 'training_metrics.csv'))
    df_loan[['loss', 'val_loss']].plot()
    plt.xlabel('epochs')
    plt.title('train/val loss')
    plt.savefig(os.path.join(self.tdr, 'training_metrics.png'))

use the CSVLogger callback to first generate the training and validation loss data. After that use this CustomCallbackPlot to plot it.

    csv_logger = CSVLogger(os.path.join(self.training_data_dir, 'training_metrics.csv'))
    callbacks = [csv_logger, CustomCallbackPlot(self.training_data_dir)]

in my example I use the training_data_dir to store the path.

Yehudit answered 24/3, 2021 at 11:56 Comment(0)

© 2022 - 2024 — McMap. All rights reserved.