There are several aspects to your question.
What you can build with the data you have
There are several kinds of retention. For simplicity, we’ll mention only two :
- Day-N retention : if a user registered on day 0, did she log in on day N ? (Logging on day N+1 does not affect this metric). To measure it, you need to keep track of all the logs of your users.
- Rolling retention : if a user registered on day 0, did she log in on day N or any day after that ? (Logging in on day N+1 affects this metric). To measure it, you just need the last know logs of your users.
If I understand your table correctly, you have two relevant variables to build your cohort table : registration date, and last log (visit week). The number of weekly visits seems irrelevant.
So with this you can only go with option 2, rolling retention.
How to build the table
First, let's build a dummy data set so that we have enough to work on and you can reproduce it :
import pandas as pd
import numpy as np
import math
import datetime as dt

np.random.seed(0) # so that we all have the same results

def random_date(start, end,p=None):
    # Return a date randomly chosen between two dates
    if p is None:
        p = np.random.random()
    return start + dt.timedelta(seconds=math.ceil(p * (end - start).days*24*3600))

n_samples = 1000 # How many users do we want ?
index = range(1,n_samples+1)

# A range of signup dates, say, one year.
end = dt.datetime.today()
from dateutil.relativedelta import relativedelta
start = end - relativedelta(years=1)

# Create the dataframe
users = pd.DataFrame(np.random.rand(n_samples),
                     index=index, columns=['signup_date'])
users['signup_date'] = users['signup_date'].apply(lambda x : random_date(start, end,x))
# last logs randomly distributed within 10 weeks of singing up, so that we can see the retention drop in our table
users['last_log'] = users['signup_date'].apply(lambda x : random_date(x, x + relativedelta(weeks=10)))
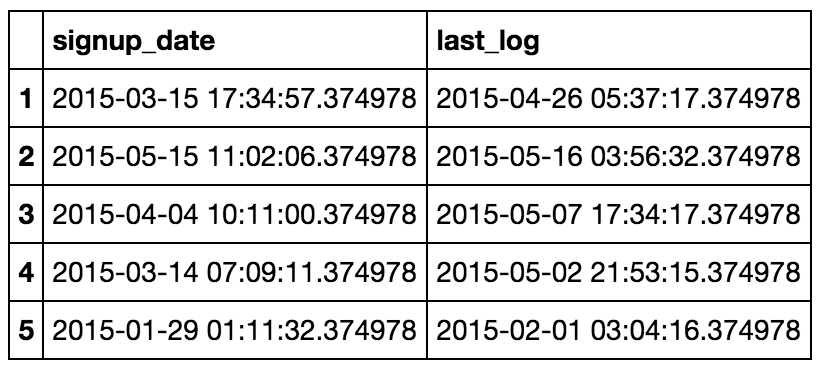
So now we should have something that looks like this :
users.head()
![enter image description here]()
Here is some code to build a cohort table :
### Some useful functions
def add_weeks(sourcedate,weeks):
    return sourcedate + dt.timedelta(days=7*weeks)

def first_day_of_week(sourcedate):
    return sourcedate - dt.timedelta(days = sourcedate.weekday())

def last_day_of_week(sourcedate):
    return sourcedate + dt.timedelta(days=(6 - sourcedate.weekday()))

def retained_in_interval(users,signup_week,n_weeks,end_date):
    '''
        For a given list of users, returns the number of users
        that signed up in the week of signup_week (the cohort)
        and that are retained after n_weeks
        end_date is just here to control that we do not un-necessarily fill the bottom right of the table
    '''
    # Define the span of the given week
    cohort_start       = first_day_of_week(signup_week)
    cohort_end         = last_day_of_week(signup_week)
    if n_weeks == 0:
        # If this is our first week, we just take the number of users that signed up on the given period of time
        return len( users[(users['signup_date'] >= cohort_start)
                        & (users['signup_date'] <= cohort_end)])
    elif pd.to_datetime(add_weeks(cohort_end,n_weeks)) > pd.to_datetime(end_date) :
        # If adding n_weeks brings us later than the end date of the table (the bottom right of the table),
        # We return some easily recognizable date (not 0 as it would cause confusion)
        return float("Inf")
    else:
        # Otherwise, we count the number of users that signed up on the given period of time,
        # and whose last known log was later than the number of weeks added (rolling retention)
        return len( users[(users['signup_date'] >= cohort_start)
                        & (users['signup_date'] <= cohort_end)
                        & pd.to_datetime((users['last_log'])    >=  pd.to_datetime(users['signup_date'].map(lambda x: add_weeks(x,n_weeks))))
                        ])
With this we can create the actual function :
def cohort_table(users,cohort_number=6,period_number=6,cohort_span='W',end_date=None):
    '''
        For a given dataframe of users, return a cohort table with the following parameters :
        cohort_number : the number of lines of the table
        period_number : the number of columns of the table
        cohort_span : the span of every period of time between the cohort (D, W, M)
        end_date = the date after which we stop counting the users
    '''
    # the last column of the table will end today :
    if end_date is None:
        end_date = dt.datetime.today()
    # The index of the dataframe will be a list of dates ranging
    dates = pd.date_range(add_weeks(end_date,-cohort_number), periods=cohort_number, freq=cohort_span)

    cohort = pd.DataFrame(columns=['Sign up'])
    cohort['Sign up'] = dates
    # We will compute the number of retained users, column-by-column
    #      (There probably is a more pythonesque way of doing it)
    range_dates = range(0,period_number+1)
    for p in range_dates:
        # Name of the column
        s_p = 'Week '+str(p)
        cohort[s_p] = cohort.apply(lambda row: retained_in_interval(users,row['Sign up'],p,end_date), axis=1)

    cohort = cohort.set_index('Sign up')
    # absolute values to percentage by dividing by the value of week 0 :
    cohort = cohort.astype('float').div(cohort['Week 0'].astype('float'),axis='index')
    return cohort
Now you can call it and see the result :
cohort_table(users)
![enter image description here]()
Hope it helps


