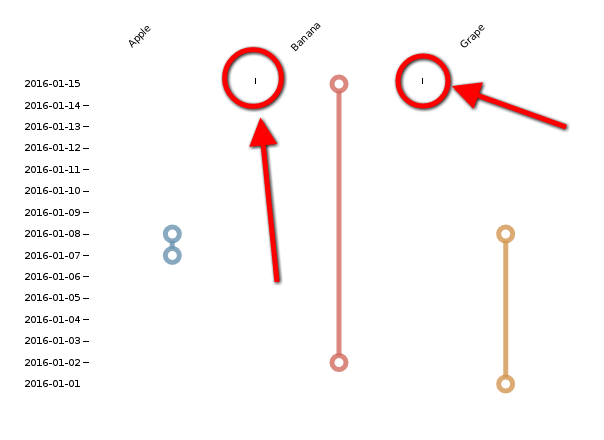
Remove tick marks in d3 / dimple
Asked Answered
P

4

6

How can I remove the tick marks without removing the associated label? I want to keep the labels ("banana", etc), but not the highlighted ticks.

Here is a similar fiddle.

Tick Marks

var svg = dimple.newSvg("#chartContainer", 1000, 1000);
var data = [
      { "date" : '2016-01-01', "project" : "Grape", "status" : 1 },
      { "date" : '2016-01-08', "project" : "Grape", "status" : -2 },
      { "date" : '2016-01-07', "project" : "Apple", "status" : 3 },
      { "date" : '2016-01-08', "project" : "Apple", "status" : 1 },
      { "date" : '2016-01-02', "project" : "Banana", "status" : -2 },
      { "date" : '2016-01-15', "project" : "Banana", "status" : 2 },
    ];
var chart = new dimple.chart(svg,data);
chart.setBounds(100, 100, 500, 300);
var x = chart.addCategoryAxis("x", "project");
var y = chart.addTimeAxis("y", "date", "%Y-%m-%d", "%Y-%m-%d");

y.addOrderRule("date");

var lines = chart.addSeries(["project"], dimple.plot.line, [x, y]);

lines.data = data;
lines.lineWeight = 5;
lines.lineMarkers = true;

chart.draw();
Pantechnicon answered 15/4, 2016 at 8:16 Comment(0)
U
12

I would just do this in the CSS:

.tick line{
  visibility:hidden;
}

Basically all the lines inside the tick can be hidden.

If you just wanted the x axis ticks to be hidden, I would give that axis an ID rather than a class which you have now, and in you css have something like so (this is if you give it an ID of xAxis) :

#xAxis.tick line{
      visibility:hidden;
    }

Updated fiddle : http://jsfiddle.net/thatoneguy/1hotquwf/10/

Untrimmed answered 15/4, 2016 at 8:24 Comment(3)
It's all magic to me. First time in 5 years fiddling with front end things ... :) Thanks for relieving my headache.Pantechnicon
No problem :) I know the feeling :PUntrimmed
For those using nvd3, add this to you styles (scss) .nv-x { .tick line{ visibility:hidden; } }Phonics
C
13

For d3.js v5, use this:

axis.tickSize(0)

Related docs

Carner answered 16/1, 2020 at 19:12 Comment(0)
U
12

I would just do this in the CSS:

.tick line{
  visibility:hidden;
}

Basically all the lines inside the tick can be hidden.

If you just wanted the x axis ticks to be hidden, I would give that axis an ID rather than a class which you have now, and in you css have something like so (this is if you give it an ID of xAxis) :

#xAxis.tick line{
      visibility:hidden;
    }

Updated fiddle : http://jsfiddle.net/thatoneguy/1hotquwf/10/

Untrimmed answered 15/4, 2016 at 8:24 Comment(3)
It's all magic to me. First time in 5 years fiddling with front end things ... :) Thanks for relieving my headache.Pantechnicon
No problem :) I know the feeling :PUntrimmed
For those using nvd3, add this to you styles (scss) .nv-x { .tick line{ visibility:hidden; } }Phonics
A
0

If you are using D3.js V5 with DC.js, just use the following code:

chart.xAxis().tickSize([0,0]) // First element refer to inner tick, second element refer to outer tick

According to D3's official documentation:

# axis.tickSize([inner, outer])

If inner, outer are specified, sets the inner and outer tick sizes to the specified value and returns the axis. If inner, outer are not specified, returns the current inner tick size, which defaults to 6.
Aguish answered 20/9, 2020 at 16:0 Comment(0)
B
0

You can just remove ticks without keeping them inside the DOM. You don't need them anyways if I understand well. By keeping extra elements in HTML and classes in CSS you have unnecessary level of complexity both visually and logically. That can result with an application hard to load and maintain in few months.

d3.select('#chartContainer').selectAll('.tick').selectAll('line').remove();

This will select your chart with the id='chartContainer', then all group elements with "tick" class and finally line elements that represent the ticks and will remove them.

Bondholder answered 4/3, 2021 at 15:43 Comment(0)

© 2022 - 2024 — McMap. All rights reserved.