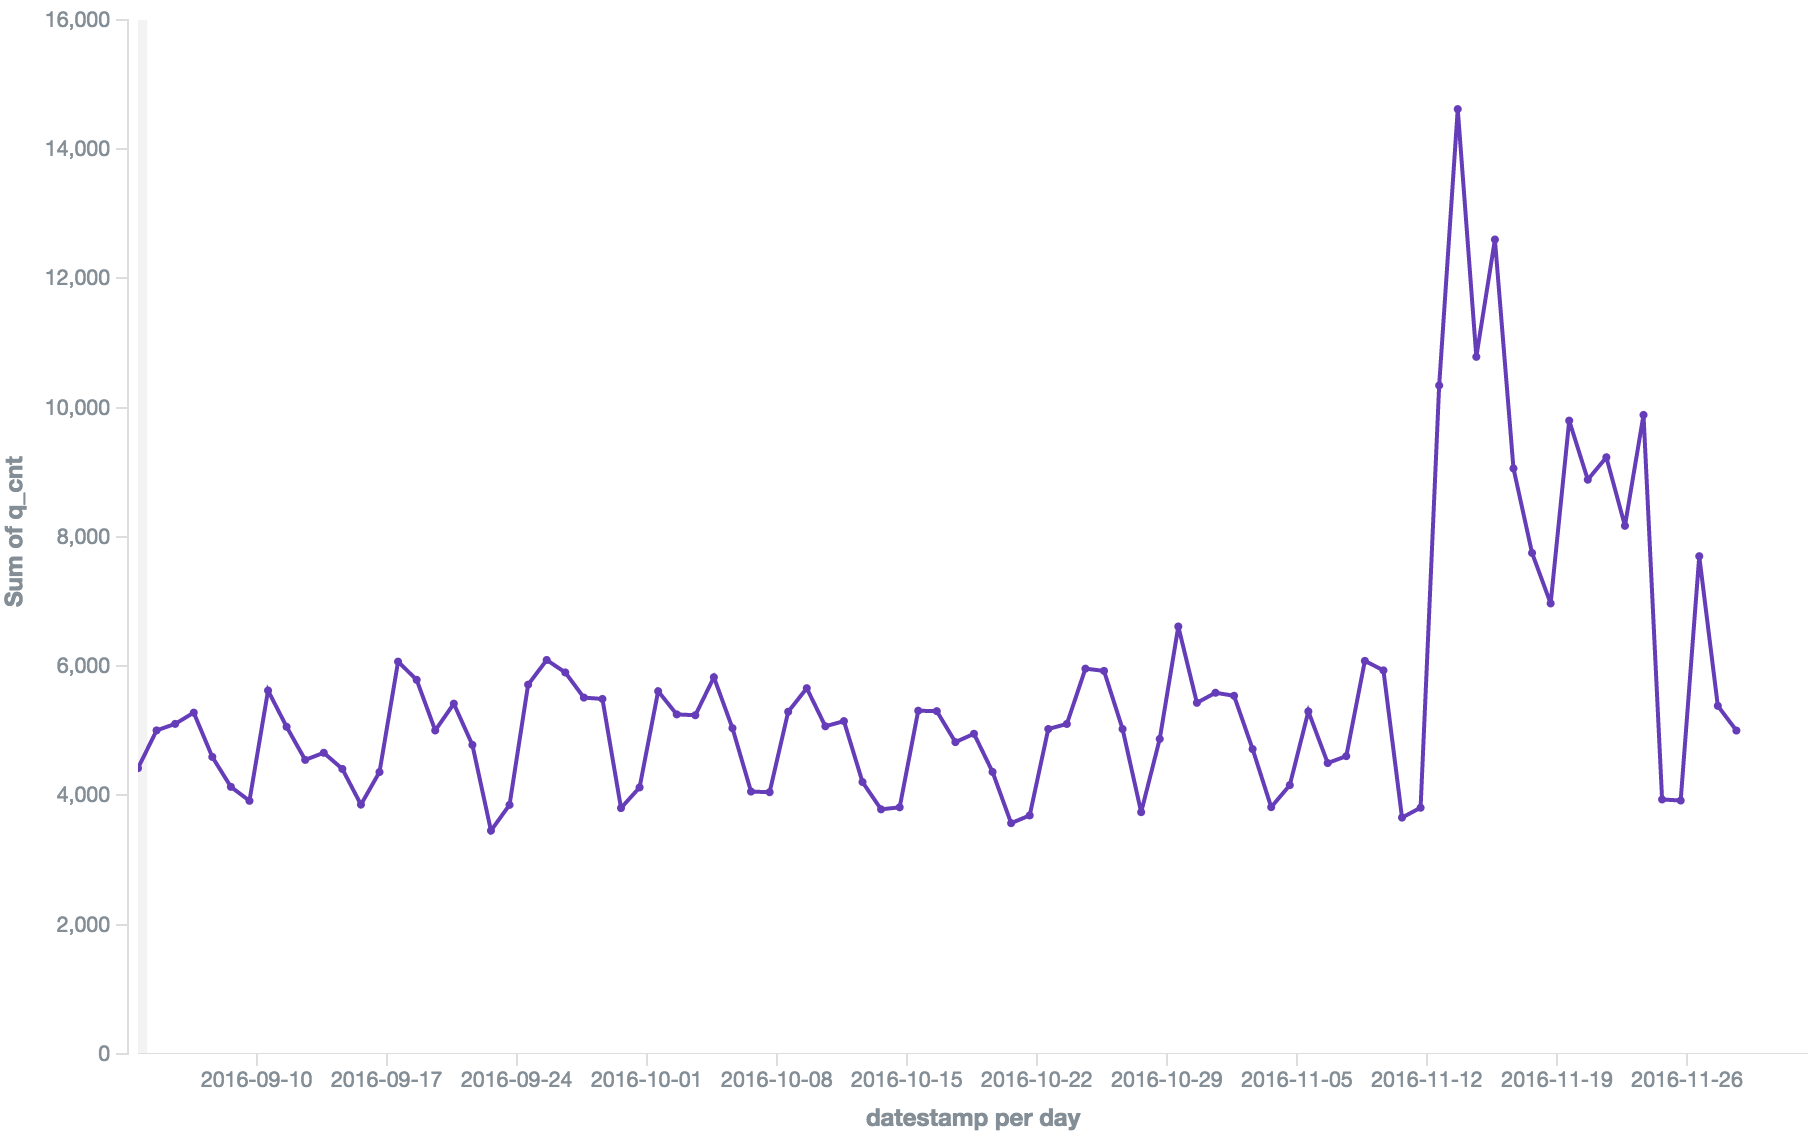
As far as data is from same index we should be able to do it.
Any chart visualization edit buckets configuration will have option to split line/chart using that you can do split lines.Here you can do split by attribute also if you want to go with date you can go with following steps in high level.
In Visualize, select Line Chart
For Y-Axis, select "Average", then select PRICE -- note, you can't plot the exact prices, it has to be some bucketing function
In X-Axis, select "Date Histogram", then select CHK_IN_DATE
Then select "Add Sub-Buckets", select "Split Lines", select "Terms", select "SOURCE_SITE_C"
You should get something similar to the screenshot below.
If your graph ends up being too messy with more lines than you expected, switch the order of steps 3 and 4 (or just use the arrow keys to switch the order of operations, see this blog80 for explanation)


