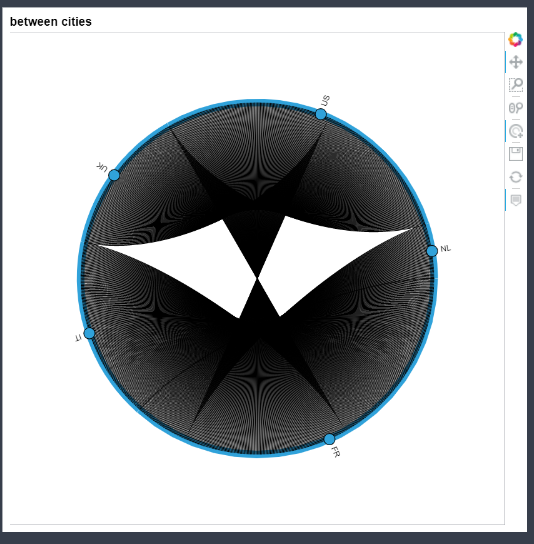
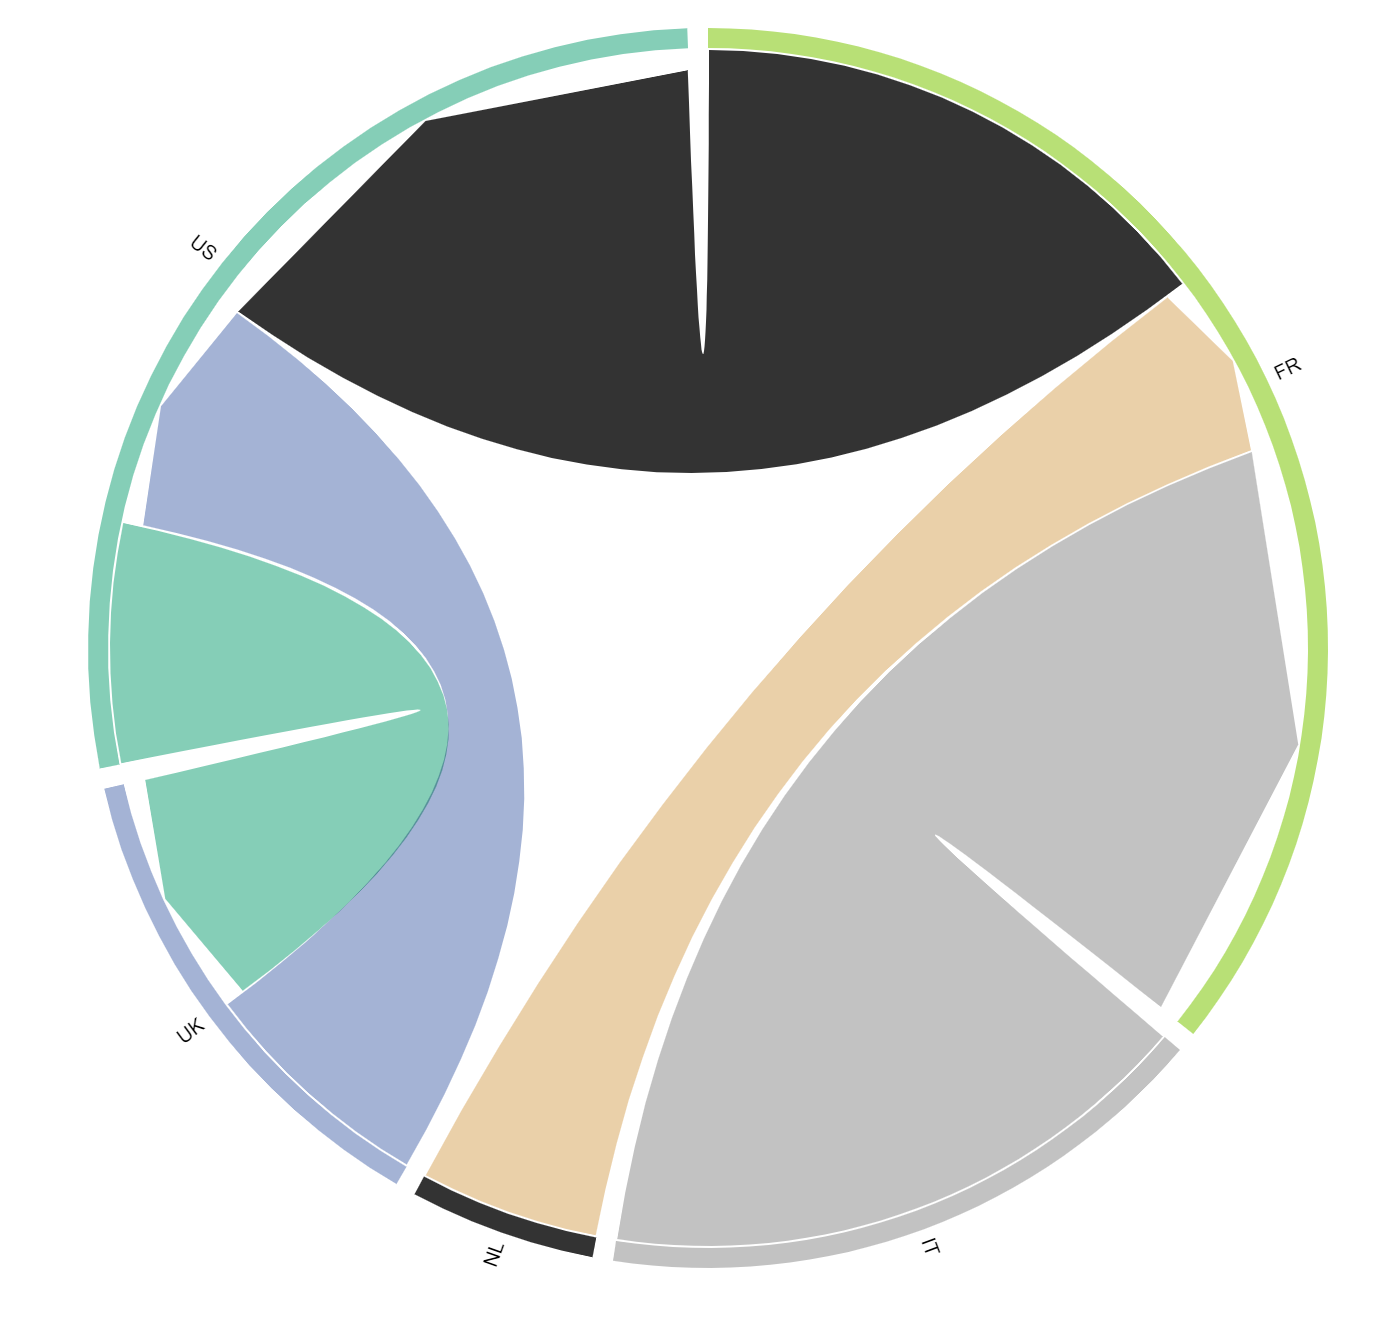
I want to create a Chord diagram for the following dataset where I have the first two columns as physical locations and a third column showing how many people visited both.
Place1   Place2    Count
US       UK        200
FR       US        450
UK       US        200
NL       FR        150
IT       FR        500
I tried using Holoviews but I couldn't make it work
nodes = hv.Dataset(df, 'Place1', 'Place2')
chord = hv.Chord((df, nodes), ['Place1', 'Place2'], ['Count'])
graph = chord.select(selection_mode='nodes')
But I get the following error: DataError: None of the available storage backends were able to support the supplied data format.
How can I use this dataframe to create a Chord diagram?


