Circular Chord Diagram in Python
Asked Answered
B

2

1

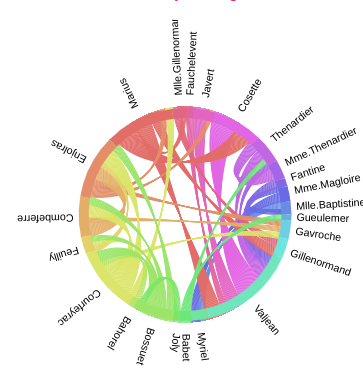
enter image description here

I would like to create a circular chord diagram

I found this link of chord diagram in plotly v3, but in version4 this seams to be not available.

Same for chord diagram in bokeh the new version does not contain a way to create a chord diagram.

How to create a chord diagram with Python?

Bedevil answered 17/12, 2020 at 16:10 Comment(0)
B
1

You can use Chord of holoviews

import pandas as pd
import holoviews as hv
from holoviews import opts, dim
from bokeh.sampledata.les_mis import data

hv.extension('bokeh')
hv.output(size=200)
links = pd.DataFrame(data['links'])
print(links.head(3))
hv.Chord(links)
Bedevil answered 17/12, 2020 at 16:17 Comment(1)
How do you display such a 3dgraph in a notebook?Quintal
D
3

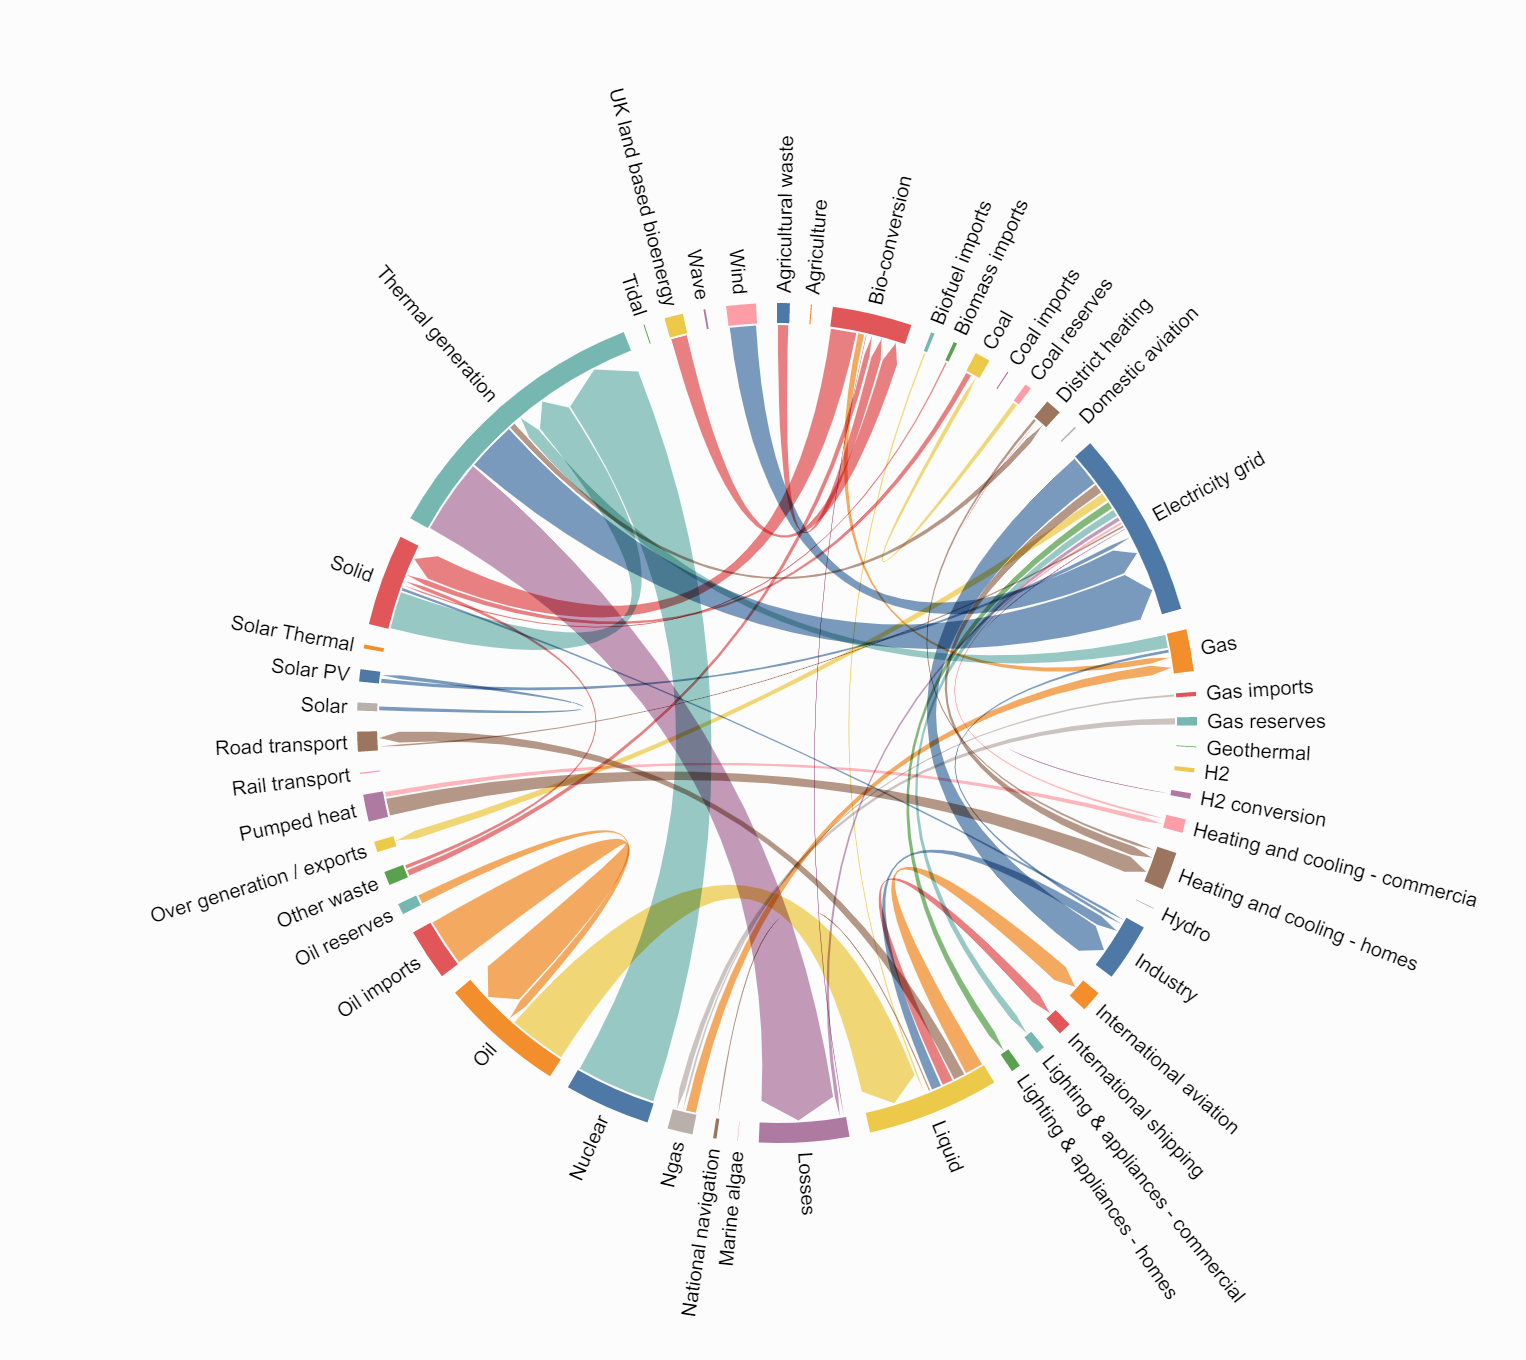
With the D3Blocks library you can create Chord chart in d3js.

# Install
pip install d3blocks

# Load d3blocks
from d3blocks import D3Blocks

# Initialize
d3 = D3Blocks()

# Load example data
df = d3.import_example('energy')

# Plot
d3.chord(df)

# Or specify the output path
d3.chord(df, filepath='c:/temp/chord.html')

enter image description here

Depression answered 7/10, 2022 at 9:52 Comment(2)
Hi Erdogant, I tried that example and got a file not found error: [d3blocks] >INFO> File not found: [file:////var/folders/sq/x6ltmdb54k12dqb29xfz7xxw0000gn/T/d3blocks/chord.html] Also, I notice the labels on your chart diagram don't match the stormofswords data. Your labels are from the energy dataset, unless I'm mistaken.Novobiocin
The default writing dir is temp. However, maybe it has to do something with system rights or a full disk (?) You can try to set the writing path to something else. I updated the example.Depression
B
1

You can use Chord of holoviews

import pandas as pd
import holoviews as hv
from holoviews import opts, dim
from bokeh.sampledata.les_mis import data

hv.extension('bokeh')
hv.output(size=200)
links = pd.DataFrame(data['links'])
print(links.head(3))
hv.Chord(links)
Bedevil answered 17/12, 2020 at 16:17 Comment(1)
How do you display such a 3dgraph in a notebook?Quintal

© 2022 - 2024 — McMap. All rights reserved.