Can I convert spectrograms generated with librosa back to audio?
Asked Answered
H

2

7

I converted some audio files to spectrograms and saved them to files using the following code:

import os
from matplotlib import pyplot as plt
import librosa
import librosa.display
import IPython.display as ipd

audio_fpath = "./audios/"
spectrograms_path = "./spectrograms/"
audio_clips = os.listdir(audio_fpath)

def generate_spectrogram(x, sr, save_name):
    X = librosa.stft(x)
    Xdb = librosa.amplitude_to_db(abs(X))
    fig = plt.figure(figsize=(20, 20), dpi=1000, frameon=False)
    ax = fig.add_axes([0, 0, 1, 1], frameon=False)
    ax.axis('off')
    librosa.display.specshow(Xdb, sr=sr, cmap='gray', x_axis='time', y_axis='hz')
    plt.savefig(save_name, quality=100, bbox_inches=0, pad_inches=0)
    librosa.cache.clear()

for i in audio_clips:
    audio_fpath = "./audios/"
    spectrograms_path = "./spectrograms/"
    audio_length = librosa.get_duration(filename=audio_fpath + i)
    j=60
    while j < audio_length:
        x, sr = librosa.load(audio_fpath + i, offset=j-60, duration=60)
        save_name = spectrograms_path + i + str(j) + ".jpg"
        generate_spectrogram(x, sr, save_name)
        j += 60
        if j >= audio_length:
            j = audio_length
            x, sr = librosa.load(audio_fpath + i, offset=j-60, duration=60)
            save_name = spectrograms_path + i + str(j) + ".jpg"
            generate_spectrogram(x, sr, save_name)

I wanted to keep the most detail and quality from the audios, so that i could turn them back to audio without too much loss (They are 80MB each).

Is it possible to turn them back to audio files? How can I do it?

Example spectrograms

I tried using librosa.feature.inverse.mel_to_audio, but it didn't work, and I don't think it applies.

I now have 1300 spectrogram files and want to train a Generative Adversarial Network with them, so that I can generate new audios, but I don't want to do it if i wont be able to listen to the results later.

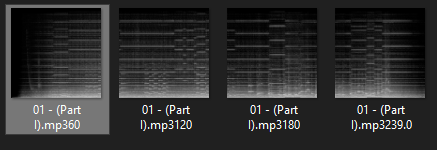
Huggins answered 10/4, 2020 at 1:4 Comment(5)
Not really - you’ve thrown away a lot of information (all of the phase, and some of the magnitude).Jenny
@PaulR STFT typically contains a lot of redundant information that can be used to estimate the phase. It's hardly perfect, but if you combine Griffin-Lim Algorithm with e.g. advances in generative deep neural networks, it can get pretty good.Dionysus
@LukaszTracewski: very interesting - OP is only saving the log magnitude spectrum though (not sure if this is quantized ?) - do you think this will still work ?Jenny
@PaulR It's a valid point that full inverse transformation is not possible (due to thresholding applied in amplitude_to_db and the saving to lossy format (jpeg). That being said, unless OP is dealing with some extreme cases, it should not be a big issue. The OP wants to "train a Generative Adversarial Network with them, so that I can generate new audios" and that's not an exact math anyway. Combine that with e.g. tensorflow/magenta and OP is off to a good start.Dionysus
Thanks - very interesting.Jenny
D
13

Yes, it is possible to recover most of the signal and estimate the phase with e.g. Griffin-Lim Algorithm (GLA). Its "fast" implementation for Python can be found in librosa. Here's how you can use it:

import numpy as np
import librosa

y, sr = librosa.load(librosa.util.example_audio_file(), duration=10)
S = np.abs(librosa.stft(y))
y_inv = librosa.griffinlim(S)

And that's how the original and reconstruction look like:

reconstruction

The algorithm by default randomly initialises the phases and then iterates forward and inverse STFT operations to estimate the phases.

Looking at your code, to reconstruct the signal, you'd just need to do:

import numpy as np

X_inv = librosa.griffinlim(np.abs(X))

It's just an example of course. As pointed out by @PaulR, in your case you'd need to load the data from jpeg (which is lossy!) and then apply inverse transform to amplitude_to_db first.

The algorithm, especially the phase estimation, can be further improved thanks to advances in artificial neural networks. Here is one paper that discusses some enhancements.

Dionysus answered 10/4, 2020 at 7:1 Comment(7)
Thanks a lot! I`ll try that, about jpg being a lossy format, should i have used png? Or is that also a lossy format? I read that using quality=100 would save the image without jpg compression, does it make sense?Huggins
@RamonGriffo Good luck! Setting quality to 100 does not typically give you lossless compression, see e.g. this answer for details #7982909 If you can afford the space, use lossless format. I often go for HDF5, optionally with high compression. If that answers your question, please accept the answer - thanks!Dionysus
Did you find out how to load/transform the jpg image as a spectrogram?, I don't think this answer answers exactly that part.Vitrescent
@Vitrescent That's because there's no unambiguous way how to do that. How can you tell how the colour scale from image translates into amplitude? With grayscale images at very least you know relative differences, so recovering a signal is not a big issue.Dionysus
@LukaszTracewski Thanks, and a hint on how to do it with greyscale image would also be great. I can do the griffinlim on a mel object but not directly on an image of a mel... so I am looking for a way to reverse the process. First generate images of spectrograms, train the model (with different existing image based GANSs) and generate resulting images and then transforming the new images back into sound. That last part is the problem.Vitrescent
Does this work for image of a spectrogram ? If I have an image, pass the image as the input and get the audio from it. Can you please share the code snippet for the same.Kingpin
@HiteshKumar Yes, S is a 2d array that we save as image. You can very well load it. As for the snippet, there's plenty of tutorials around that explain how to do that in Python in general. When the spectrogram is in a grayscale there's no ambiguity when it comes to interpreting the pixel. If the spectrogram is in colour, you have to figure out mapping between the colour scheme (3 values per pixel) and amplitude (a single value).Dionysus
A
0

I did this ex-novo in 2016 to recover audio from spectrograms for which no audio was available. I didn't know about the GLA (thanks!) but the algorithm sounds similar, complete with random phases.

As regards importing the spectrograms, for mine you indicate the corners of the graphic and its pixels-per-second and frequency range, and the start and end points of the scale and its range, and a script does the color-to-dB mapping of the graph.

Code: https://gitlab.com/martinwguy/delia-derbyshire/-/tree/master/anal Examples of its output: https://wikidelia.net/wiki/Spectrograms#Inverse_spectrograms

Aerodyne answered 24/6 at 8:47 Comment(0)

© 2022 - 2024 — McMap. All rights reserved.