Understanding TensorBoard (weight) histograms
Asked Answered
A

2

173

It is really straightforward to see and understand the scalar values in TensorBoard. However, it's not clear how to understand histogram graphs.

For example, they are the histograms of my network weights.

enter image description here

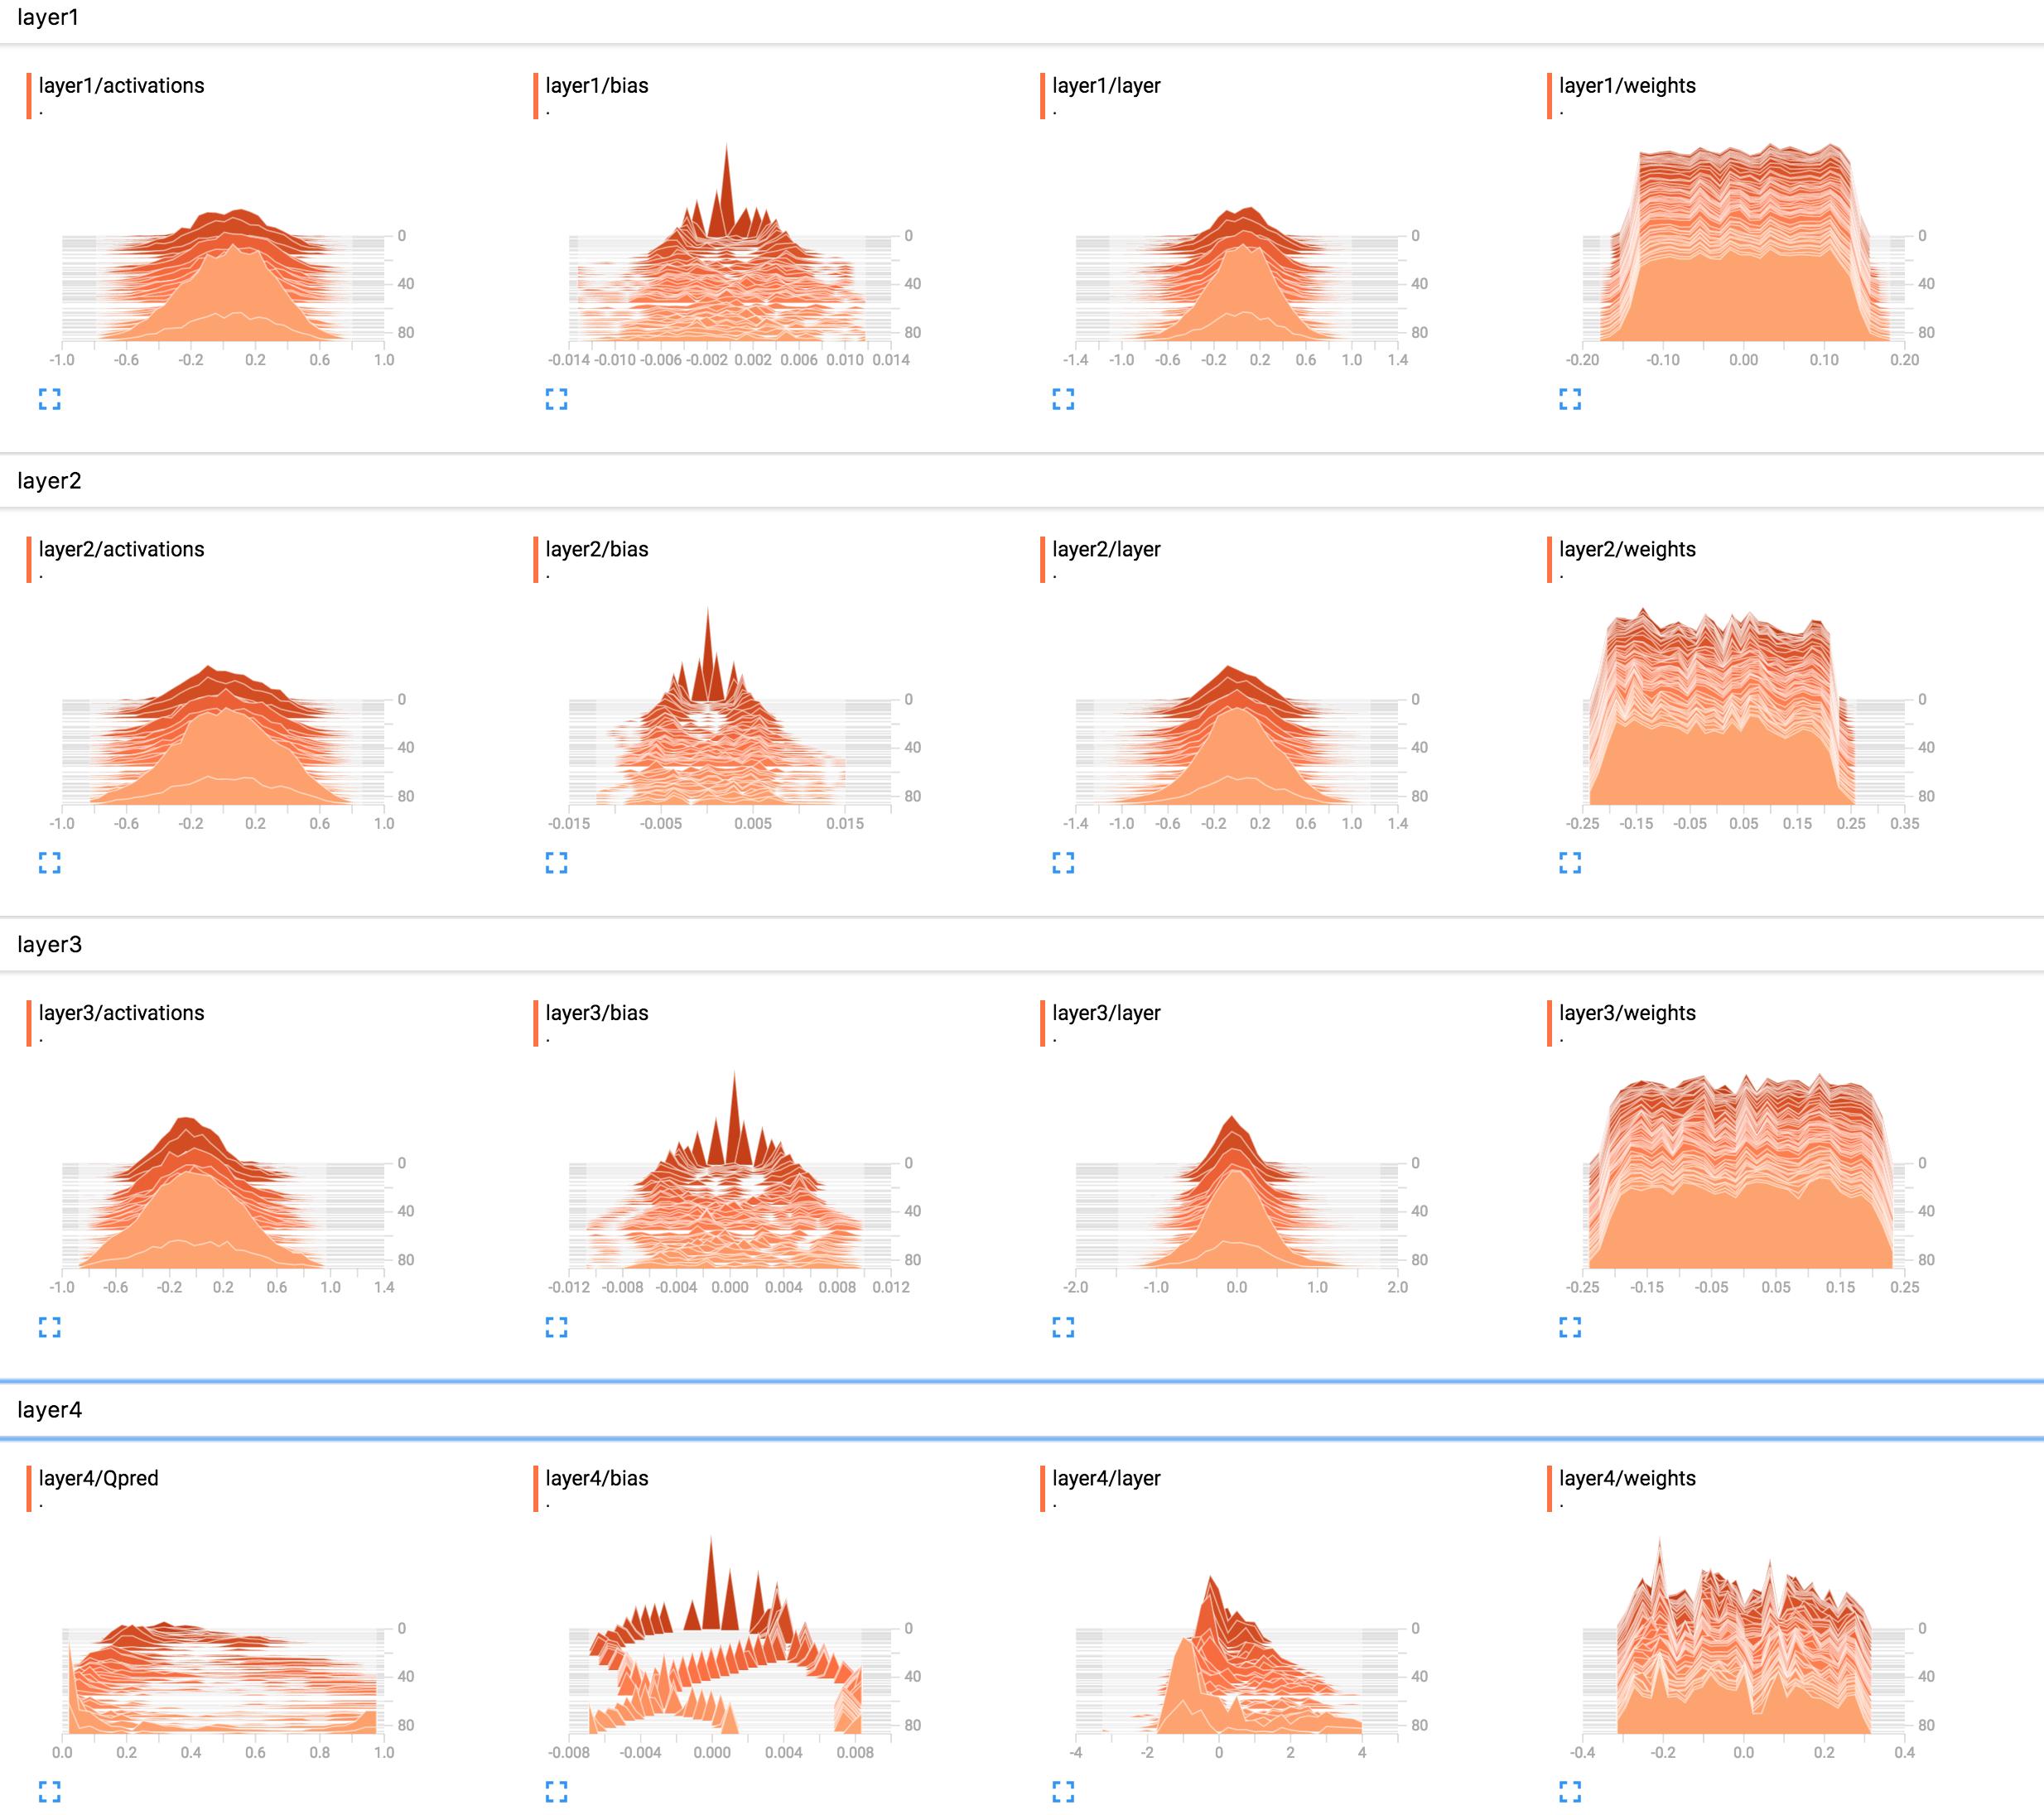
(After fixing a bug thanks to sunside) enter image description here What is the best way to interpret these? Layer 1 weights look mostly flat, what does this mean?
I added the network construction code here.

X = tf.placeholder(tf.float32, [None, input_size], name="input_x")
x_image = tf.reshape(X, [-1, 6, 10, 1])
tf.summary.image('input', x_image, 4)

# First layer of weights
with tf.name_scope("layer1"):
    W1 = tf.get_variable("W1", shape=[input_size, hidden_layer_neurons],
                         initializer=tf.contrib.layers.xavier_initializer())
    layer1 = tf.matmul(X, W1)
    layer1_act = tf.nn.tanh(layer1)
    tf.summary.histogram("weights", W1)
    tf.summary.histogram("layer", layer1)
    tf.summary.histogram("activations", layer1_act)

# Second layer of weights
with tf.name_scope("layer2"):
    W2 = tf.get_variable("W2", shape=[hidden_layer_neurons, hidden_layer_neurons],
                         initializer=tf.contrib.layers.xavier_initializer())
    layer2 = tf.matmul(layer1_act, W2)
    layer2_act = tf.nn.tanh(layer2)
    tf.summary.histogram("weights", W2)
    tf.summary.histogram("layer", layer2)
    tf.summary.histogram("activations", layer2_act)

# Third layer of weights
with tf.name_scope("layer3"):
    W3 = tf.get_variable("W3", shape=[hidden_layer_neurons, hidden_layer_neurons],
                         initializer=tf.contrib.layers.xavier_initializer())
    layer3 = tf.matmul(layer2_act, W3)
    layer3_act = tf.nn.tanh(layer3)

    tf.summary.histogram("weights", W3)
    tf.summary.histogram("layer", layer3)
    tf.summary.histogram("activations", layer3_act)

# Fourth layer of weights
with tf.name_scope("layer4"):
    W4 = tf.get_variable("W4", shape=[hidden_layer_neurons, output_size],
                         initializer=tf.contrib.layers.xavier_initializer())
    Qpred = tf.nn.softmax(tf.matmul(layer3_act, W4)) # Bug fixed: Qpred = tf.nn.softmax(tf.matmul(layer3, W4))
    tf.summary.histogram("weights", W4)
    tf.summary.histogram("Qpred", Qpred)

# We need to define the parts of the network needed for learning a policy
Y = tf.placeholder(tf.float32, [None, output_size], name="input_y")
advantages = tf.placeholder(tf.float32, name="reward_signal")

# Loss function
# Sum (Ai*logp(yi|xi))
log_lik = -Y * tf.log(Qpred)
loss = tf.reduce_mean(tf.reduce_sum(log_lik * advantages, axis=1))
tf.summary.scalar("Q", tf.reduce_mean(Qpred))
tf.summary.scalar("Y", tf.reduce_mean(Y))
tf.summary.scalar("log_likelihood", tf.reduce_mean(log_lik))
tf.summary.scalar("loss", loss)

# Learning
train = tf.train.AdamOptimizer(learning_rate=learning_rate).minimize(loss)
Aubine answered 18/2, 2017 at 12:35 Comment(6)
I just noticed that you're not using the activations at all on the last layer. You probably meant tf.nn.softmax(tf.matmul(layer3_act, W4)).Nettlesome
@Nettlesome Thanks. It turns out histogram is very useful for debugging as well. I updated pics.Aubine
@SungKim I'm using your implementation as a reference, but how do you add the bias? Like this? B1 = tf.get_variable("B1", shape=[hidden_layer_neurons],initializer=tf.random_normal_initializer()) and layer1_bias = tf.add(layer1, B1) and tf.summary.histogram("bias", layer1_bias)Monostrophe
@SungKim if you still have the log directory, could you upload it to Aughie Boards? It would be great to see the histograms in an interactive dashboardWindtight
@SungKim would you fix your code by defining input_size so that we can run it and see the result in tensorboardMoore
@Nettlesome could you please look at this question ? #77817411Portative
N
171

It appears that the network hasn't learned anything in the layers one to three. The last layer does change, so that means that there either may be something wrong with the gradients (if you're tampering with them manually), you're constraining learning to the last layer by optimizing only its weights or the last layer really 'eats up' all error. It could also be that only biases are learned. The network appears to learn something though, but it might not be using its full potential. More context would be needed here, but playing around with the learning rate (e.g. using a smaller one) might be worth a shot.

In general, histograms display the number of occurrences of a value relative to each other values. Simply speaking, if the possible values are in a range of 0..9 and you see a spike of amount 10 on the value 0, this means that 10 inputs assume the value 0; in contrast, if the histogram shows a plateau of 1 for all values of 0..9, it means that for 10 inputs, each possible value 0..9 occurs exactly once. You can also use histograms to visualize probability distributions when you normalize all histogram values by their total sum; if you do that, you'll intuitively obtain the likelihood with which a certain value (on the x axis) will appear (compared to other inputs).

Now for layer1/weights, the plateau means that:

  • most of the weights are in the range of -0.15 to 0.15
  • it is (mostly) equally likely for a weight to have any of these values, i.e. they are (almost) uniformly distributed

Said differently, almost the same number of weights have the values -0.15, 0.0, 0.15 and everything in between. There are some weights having slightly smaller or higher values. So in short, this simply looks like the weights have been initialized using a uniform distribution with zero mean and value range -0.15..0.15 ... give or take. If you do indeed use uniform initialization, then this is typical when the network has not been trained yet.

In comparison, layer1/activations forms a bell curve (gaussian)-like shape: The values are centered around a specific value, in this case 0, but they may also be greater or smaller than that (equally likely so, since it's symmetric). Most values appear close around the mean of 0, but values do range from -0.8 to 0.8. I assume that the layer1/activations is taken as the distribution over all layer outputs in a batch. You can see that the values do change over time.

The layer 4 histogram doesn't tell me anything specific. From the shape, it's just showing that some weight values around -0.1, 0.05 and 0.25 tend to be occur with a higher probability; a reason could be, that different parts of each neuron there actually pick up the same information and are basically redundant. This can mean that you could actually use a smaller network or that your network has the potential to learn more distinguishing features in order to prevent overfitting. These are just assumptions though.

Also, as already stated in the comments below, do add bias units. By leaving them out, you are forcefully constraining your network to a possibly invalid solution.

Nettlesome answered 18/2, 2017 at 17:21 Comment(14)
Amazing answer! Thanks very much. I added the code for the reference. For simplicity, I did not add bias in my network.Aubine
Could you explain a bit more for the layer4? I really appreciate it.Aubine
Not having a bias at all can be a very bad idea - it's really like trying to draw a line through a (ver high-dimensional) cloud of points, but being forced to go through the value 0; it might work, and will give you some solution, but chances are it is a bad or simply wrong one.Nettlesome
I can't tell you much from the histogram sadly. (Updated my answer though.)Nettlesome
Thanks to your comment, I added bias and updated the pictures. Please take a look. @sunside.Aubine
It should probably train a bit longer now. Especially given your first results, layer4/Qpred looks like it could get much better. As for the weights staying the same ... I find that fishy, but I cannot make sense of it right now. Could be that it really is the correct distribution, but given that there is no change at all, I find that hard to believe.Nettlesome
@Nettlesome is there any method to prioritize updating network weights over the biases? As the biases as well as the last layer do seem to suck all the error. I am having a similar issue where only the biases are updated, and the weight histogram remains relatively unchanged.Zara
@Zara That should probably be a separate question, but you could, for example, regularize the biases slightly (there be dragons) or fetch the gradients from the optimizer, scale the bias ones down a bit and optimize on that instead. This way they will learn slower.Nettlesome
@Nettlesome Thank you for the input. Will look into if further and post a separate question if it doesn't work out.Zara
A few more words about layer1/activations? Is the bell shape correct? How should it change, it that enough?Coarctate
Not having a bias is ok if using batch norm before activationCarrollcarronade
I read the answer, but still it isn't clear to me what shape of histogram or propagation of shape of histogram you would expect in the weights/biases/activations that would make you believe the net DOES learn? just anything that isn't as initialized? After the fix, layers 1 to 3 look kind of the same to me. Am I missing something?Brazilin
@Brazilin Shape doesn't matter. The shape just shows the distribution of weights. We can find out what has changed by the histogram. As for the deep reasons, it is difficult to use this to analyze.Sandpit
Thanks for an amazing answer. So if weights, activations distribution change for each epoch it means neural network is training well? What are some things we must look at while debugging whether our model is training properly? Any readings or paper you suggest?Limber
P
4

Here I would indirectly explain the plot by giving a minimal example. The following code produce a simple histogram plot in tensorboard.

from datetime import datetime
import tensorflow as tf
filename = datetime.now().strftime("%Y%m%d-%H%M%S")
fw = tf.summary.create_file_writer(f'logs/fit/{filename}')
with fw.as_default():
    for i in range(10):
        t = tf.random.uniform((2, 2), 1000)
        tf.summary.histogram(
            "train/hist",
            t,
            step=i
        )
        print(t)

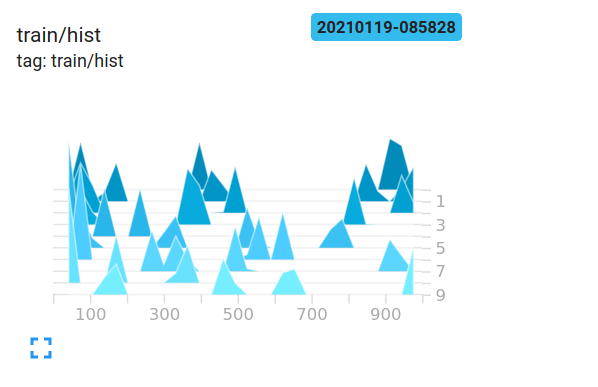
We see that generating a 2x2 matrix with a maximum range 1000 will produce values from 0-1000. To how this tensor might look, i am putting log of a few of them here.

enter image description here

 tf.Tensor(
[[398.65747  939.9828  ]
 [942.4269    59.790222]], shape=(2, 2), dtype=float32)
tf.Tensor(
[[869.5309  980.9699 ]
 [149.97845 454.524  ]], shape=(2, 2), dtype=float32)
tf.Tensor(
[[967.5063   100.77594 ]
 [ 47.620544 482.77008 ]], shape=(2, 2), dtype=float32)

We logged into tensorboard 10 times. The to right of the plot, a timeline is generated to indicate timesteps. The depth of histogram indicate which values are new. The lighter/front values are newer and darker/far values are older.

Values are gathered into buckets which are indicated by those triangle structures. x-axis indicate the range of values where the bunch lies.

Punctuality answered 19/1, 2021 at 8:5 Comment(0)

© 2022 - 2024 — McMap. All rights reserved.