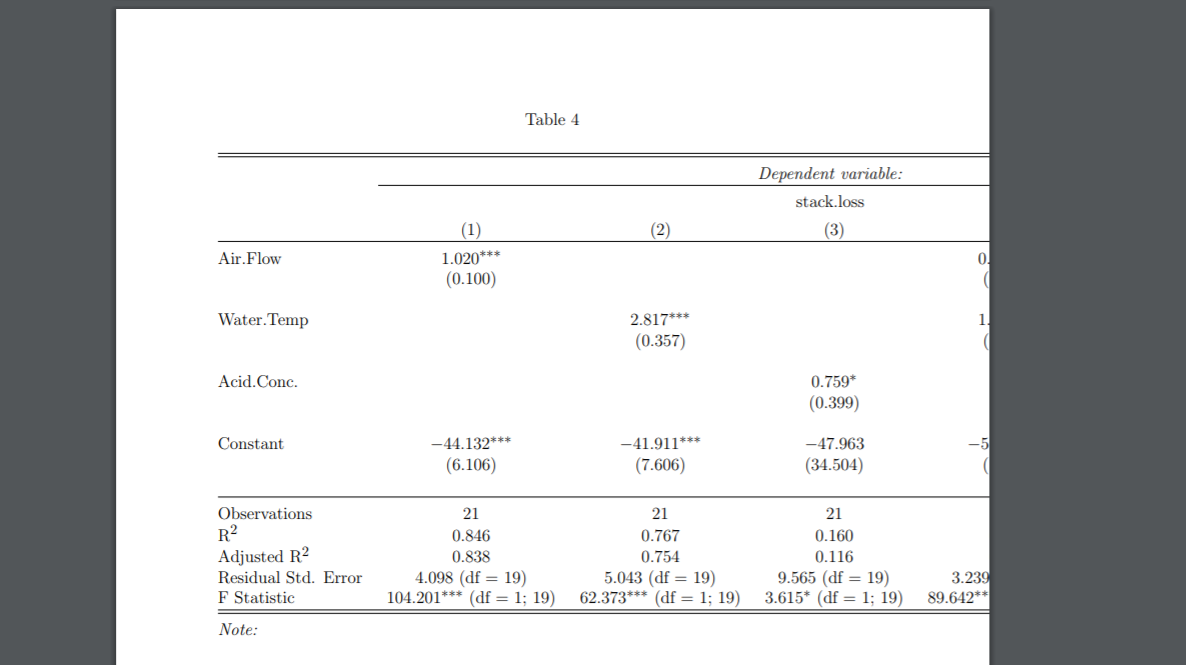
I am using Stargazer to output a regression table with multiple lm models together. The problem is that Stargazer outputs the F-Statistic and degrees of freedom in a single line by default. If you have 3 or 4 models, that means the output in latex is unnecessarily wide and extends past the page.
There is an option to hide the degrees of freedom using:
stargazer(lm1,lm2,lm3,lm4, df = F)
But, there is no way to get it to display on two rows.
Here's a reproducible example of the bad outcome:
lm.out.1 <- lm(stack.loss ~ Air.Flow , data=stackloss)
lm.out.2 <- lm(stack.loss ~ Water.Temp, data=stackloss)
lm.out.3 <- lm(stack.loss ~ Acid.Conc., data=stackloss)
lm.out.4 <- lm(stack.loss ~ Air.Flow + Water.Temp, data=stackloss)
lm.out.5 <- lm(stack.loss ~ Air.Flow + Water.Temp + Acid.Conc., data=stackloss)

stargazer(lm.out.1,
          lm.out.2,
          lm.out.3,
          lm.out.4,
          lm.out.5)
When you render the latex output, you get an unnecessarily wide table:

Which is outside the margins when your render to print:

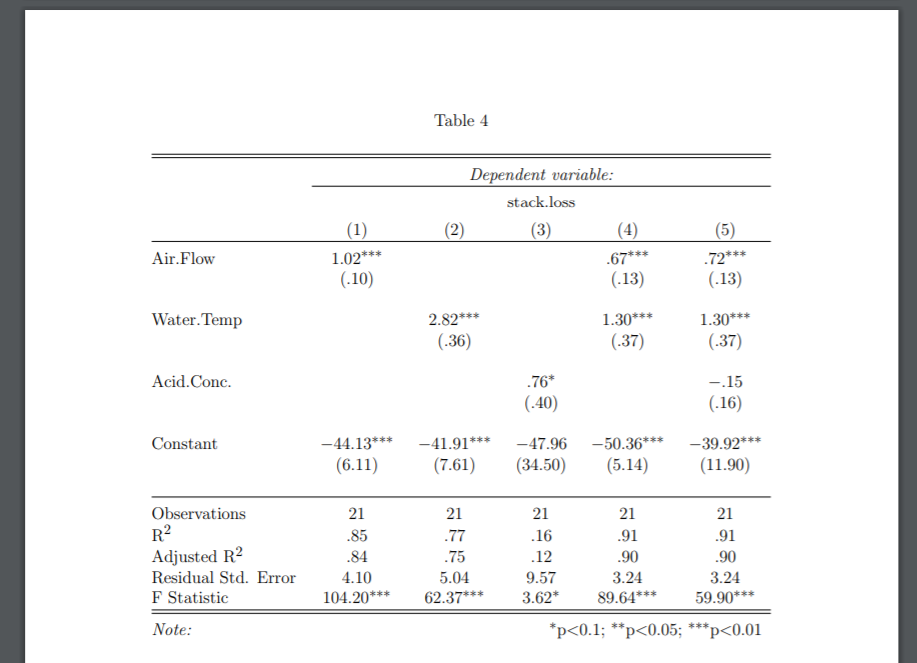
It is possible to see how this table could be neatly and efficiently rendered in a printable manner using the df=F option:
stargazer(lm.out.1,
          lm.out.2,
          lm.out.3,
          lm.out.4,
          lm.out.5, df = F)
BUT, now we have lost the information about the degrees of freedom.
Is there any way to print that information with a line-break so that it prints on two rows of the table?
There seems to be something helpful posted by the package author here - about adding degrees of freedom: Displaying degrees of freedom in stargazer table
I am not sure how to take that and get the desired output of F-Stat and DF on two lines...


