In gnuplot, with "set datafile missing", how to ignore both "nan" and "-nan"?
Asked Answered
F

2

8

The gnuplot command set datafile missing "nan" tells gnuplot to ignore nan data values in the data file.

How to ignore both nan and -nan? I tried the following in gnuplot, but then the effect of the first statement is overwritten by the next.

gnuplot> set datafile missing "-nan"
gnuplot> set datafile missing "nan"

Is it possible to somewhow embed a grep -v nan in the gnuplot command, or even some kind of regexp to exclude any imaginable non-numerical data?

Fungoid answered 10/9, 2013 at 11:44 Comment(2)
Refer to this question for using grep with gnuplot commnad #7600548Kugler
Upvote for being the #1 pick in Google June 2018Dribble
C
8

It is not possible to use a regexp for set datafile missing, but you can use any program to filter you data before plotting, and replacing a regexp with one character, e.g. ? which you set to mark a missing data point.

Here is an example which accomplishes, what you originally requested: filtering -nan, inf etc. For testing, I used the following data file:

1 0
2 nan
3 -inf
4 2
5 -NaN
6 1

And the plotting script may look like the following:

filter = 'sed -e "s/-\?\(nan\|inf\)/?/ig"'
set datafile missing "?"
set offset 0.5,0.5,0.5,0.5
plot '< '.filter.' data.txt' with linespoints ps 2 notitle

This gives the following output:

enter image description here

So the plot command skips all missing data points. You can refine the sed filter to replace any non-numerical values with ?, if this variant is not enough.

This works fine, but allows only to select columns e.g. with using 1:2, but not doing computations on the columns, like e.g. using ($1*0.1):2. To allow this, you can filter out any row, which contains nan, -inf etc with grep, like its done in gnuplot missing data with expression evaluation (thanks @Thiru for the link):

filter = 'grep -vi -- "-\?\(nan\|inf\)"'
set offset 0.5,0.5,0.5,0.5
plot '< '.filter.' data.txt' with linespoints ps 2 notitle
Cantara answered 10/9, 2013 at 12:8 Comment(3)
This is really good, thanks! Your suggested sed filter only replaces the first match by a "?". It is really fine for my purpose because gnuplot will ignore a line if there is just one "?" in it. It's a bit off-topic question now: How can the filter replace all occurrences of the relevant strings, for example with "inf -nan 2.43" the filtered one should be "? ? 2.43"Fungoid
@Fungoid Just add a g behind the i in the sed pattern. I'll update the answer.Cantara
Upvote for being the #1 pick in Google June 2018, and for allowing me to get this answer in under a minute. This is a great database because of contributors like yourself.Dribble
V
0

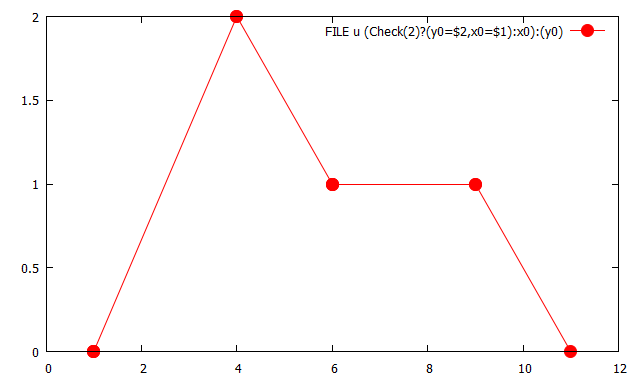
Here is a simple gnuplot-only solution without using sed or grep, hence, platform-independent. You can also do calulations on the columns, e.g. x0=$1*0.1 or y0=$2**2.

There is the gnuplot function valid() which checks if a column value is valid (check help valid). This works for NaN, nan, -nan, etc., but strangely inf, +inf and -inf are considered as valid. So, you have to filter them separately as well.

The simple "trick" making the linespoints plot connected between datapoints, even without set datafile missing is taken from here.

Data: SO18718100.dat

1 0
2 nan
3 -inf
4 2
5 -NaN
6 1
7 +inf
8 +NaN
9 1
10 inf
11 0

Script: (works with gnuplot>=4.6.0, March 2012)

### ignore several non-valid data entries
reset

FILE = "SO18718100.dat"
Check(col) = valid(col) && !(s=strcol(col), s[sgn(strstrt('+-',s[1:1]))+1:strlen(s)] eq "inf") 

plot FILE u (Check(2)?(y0=$2,x0=$1):x0):(y0) w lp pt 7 ps 2 lc rgb "red"
### end of script

The shortest version if you don't have inf values in your data would be:

plot FILE u (valid(2)?(y0=$2,x0=$1):x0):(y0) w lp

Result:

enter image description here

Voiceful answered 26/8, 2022 at 6:36 Comment(0)

© 2022 - 2024 — McMap. All rights reserved.