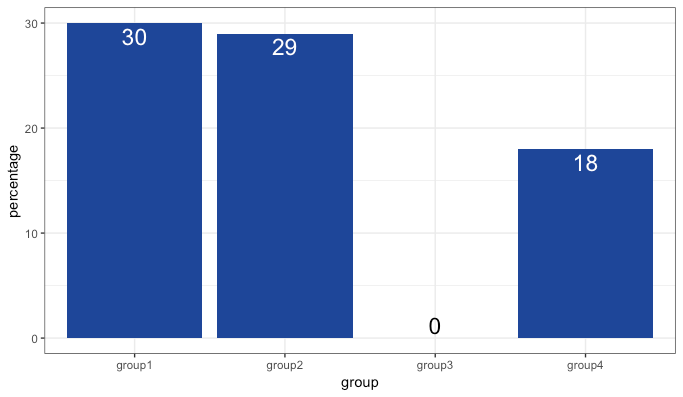
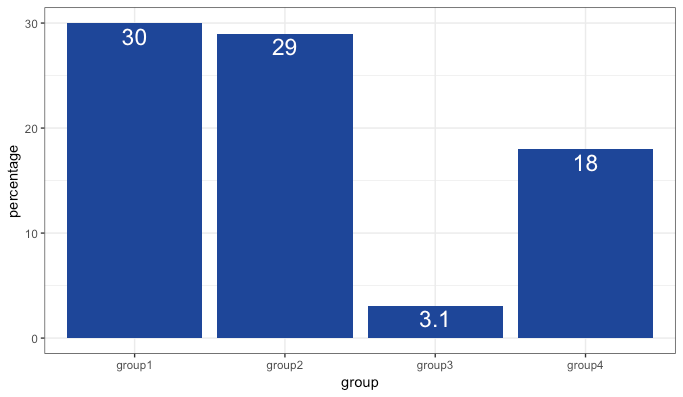
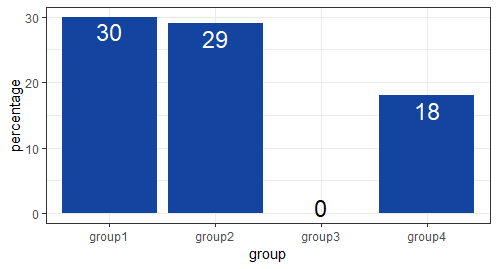
I'm trying to create a bar plot with the depicted values written inside the bars using ggplot2. I still want to label the group with value "0" but in a different colour (black) and just above the x-axis. How can I change the position and colour of just this one geom_text?
I've already tried entering a vector into scale_colour_manual but it didn't work (or I didn't do it right).
data <- read.table(text = "group percentage
               group1 30
               group2 29
               group3 0
               group4 18", header=TRUE)

library(ggplot2)
ggplot(data, aes(x=group, y=percentage))+
  theme_bw()+
  geom_bar(stat = 'identity', position = "dodge", fill="#13449f")+
  geom_text(aes(label = percentage), position = position_dodge(0.9),
  vjust=1.3, colour = "white", size=6)
With this code there is no label for group3 since there is no bar either. I'd like to still have a label in black above the x-axis.


