Group rows by overlapping ranges
Asked Answered
E

3

8

I have a dataframe, where the left column is the left - most location of an object, and the right column is the right most location. I need to group the objects if they overlap, or they overlap objects that overlap (recursively). So, for example, if this is my dataframe:

     left  right
0      0    4
1      5    8
2      10   13
3      3    7
4      12   19      
5      18   23
6      31   35

so lines 0 and 3 overlap - thus they should be on the same group, and also line 1 is overlapping line 3 - thus it joins the group.

So, for this example the output should be something like that:

     left  right    group
0      0    4         0
1      5    8         0
2      10   13        1
3      3    7         0
4      12   19        1
5      18   23        1
6      31   35        2

I thought of various directions, but didn't figure it out (without an ugly for). Any help will be appreciated!

Emplane answered 13/1, 2018 at 19:26 Comment(0)
E
4

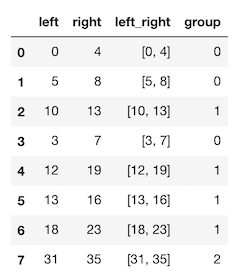
I found the accepted solution (update: now deleted) to be misleading because it fails to generalize to similar cases. e.g. for the following example:

df = pd.DataFrame({'left': [0,5,10,3,12,13,18,31], 
    'right':[4,8,13,7,19,16,23,35]})
df

The suggested aggregate function outputs the following dataframe (note that the 18-23 should be in group 1, along with 12-19).

enter image description here

One solution is using the following approach (based on a method for combining intervals posted by @CentAu):

# Union intervals by @CentAu
from sympy import Interval, Union
def union(data):
    """ Union of a list of intervals e.g. [(1,2),(3,4)] """
    intervals = [Interval(begin, end) for (begin, end) in data]
    u = Union(*intervals)
    return [u] if isinstance(u, Interval) \
        else list(u.args)

# Create a list of intervals
df['left_right'] = df[['left', 'right']].apply(list, axis=1)
intervals = union(df.left_right)

# Add a group column
df['group'] = df['left'].apply(lambda x: [g for g,l in enumerate(intervals) if 
l.contains(x)][0])

...which outputs:

enter image description here

Etamine answered 16/11, 2018 at 23:22 Comment(2)
Base on your idea why 13 16 and 18 23 have the over lap can you explain ? So you think it is network problem?Phlebosclerosis
@W-B if you are trying to combine overlapping ranges, then there are three groups: 0 (0-8), 1 (10-23), and 2 (31-35). In answer to your question, 13-16 and 18-23 overlap because they are joined by 12-19. Try looking at interval trees: en.wikipedia.org/wiki/Interval_treeEtamine
P
3

Can you try this, use rolling max and rolling min, to find the intersection of the range :

df=df.sort_values(['left','right'])
df['Group']=((df.right.rolling(window=2,min_periods=1).min()-df.left.rolling(window=2,min_periods=1).max())<0).cumsum()


df.sort_index()
Out[331]: 
   left  right  Group
0     0      4      0
1     5      8      0
2    10     13      1
3     3      7      0
4    12     19      1
5    18     23      1
6    31     35      2

For example , (1,3) and (2,4) To find the intersection

mix(3,4)-max(1,2)=1 ; 1 is more than 0; then two intervals have intersection

Phlebosclerosis answered 13/1, 2018 at 20:21 Comment(4)
Your idea of sort_values was inspirational.Spoonful
This is a great answer, and I wish I could accept both answers. Unfortunately I can't, and @COLDSPEED's answer seems to be a bit more straightforward. Thanks a lot anyway!Emplane
@BinyaminEven no problem , happy codingPhlebosclerosis
This approach fails to generalise to similar datasets (e.g. for pd.DataFrame({'left': [0,5,10,3,12,13,18,31], 'right':[4,8,13,7,19,16,23,35]}), 18-23 is in a different group to 12-19.Etamine
O
2

You can sort samples and utilize cumulative functions cummax and cumsum. Let's take your example:

   left  right
0     0      4
3     3      7
1     5      8
2    10     13
4    12     19
5    13     16
6    18     23
7    31     35

First you need to sort values so that longer ranges come first:

df = df.sort_values(['left', 'right'], ascending=[True, False])

Result:

   left  right
0     0      4
3     3      7
1     5      8
2    10     13
4    12     19
5    13     16
6    18     23
7    31     35

Then you can find overlapping groups through comparing 'left' with previous 'right' values:

df['group'] = (df['right'].cummax().shift() <= df['left']).cumsum()
df.sort_index(inplace=True)

Result:

   left  right  group
0     0      4      0
1     5      8      0
2    10     13      1
3     3      7      0
4    12     19      1
5    13     16      1
6    18     23      1
7    31     35      2

In one line:

Oxidize answered 17/5, 2021 at 7:41 Comment(0)

© 2022 - 2024 — McMap. All rights reserved.