Efficiently find the number of different classmates from course-level data
Asked Answered
L

7

8

I have been stuck with computing efficiently the number of classmates for each student from a course-level database.

Consider this data.frame, where each row represents a course that a student has taken during a given semester:

dat <- 
  data.frame(
  student = c(1, 1, 2, 2, 2, 3, 4, 5),
  semester = c(1, 2, 1, 2, 2, 2, 1, 2),
  course = c(2, 4, 2, 3, 4, 3, 2, 4)
)

#   student semester course
# 1       1        1      2
# 2       1        2      4
# 3       2        1      2
# 4       2        2      3
# 5       2        2      4
# 6       3        2      3
# 7       4        1      2
# 8       5        2      4

Students are going to courses in a given semester. Their classmates are other students attending the same course during the same semester. For instance, across both semesters, student 1 has 3 classmates (students 2, 4 and 5).

How can I get the number of unique classmates each student has combining both semesters? The desired output would be:

  student n
1       1 3
2       2 4
3       3 1
4       4 2
5       5 2

where n is the value for the number of different classmates a student has had during the academic year.

I sense that an igraph solution could possibly work (hence the tag), but my knowledge of this package is too limited. I also feel like using joins could help, but again, I am not sure how.

Importantly, I would like this to work for larger datasets (mine has about 17M rows). Here's an example data set:

set.seed(1)
big_dat <- 
  data.frame(
    student = sample(1e4, 1e6, TRUE),
    semester = sample(2, 1e6, TRUE),
    course = sample(1e3, 1e6, TRUE)
  )
Lockyer answered 9/7 at 16:49 Comment(2)
What is the basis for Student 1 having Students 2, 4, 5 as course mates across both semesters? I don't readily see that relationship in the data set.Osculate
Two students are classmates if they share the same value of semester and course at least once. So, Student 1 is a classmate of Student 2 and Student 4 because they went to course 2 during semester 1 together. Student 1 is also a classmate of Student 5 because they went to Course 4 during semester 2 together.Affined
G
3

First try with igraph:

library(data.table)
library(igraph)

setDT(dat)
i <- max(dat$student)
g <- graph_from_data_frame(
  dat[,.(student, class = .GRP + i), .(semester, course)][,-1:-2]
)
v <- V(g)[1:uniqueN(dat$student)]
data.frame(student = as.integer(names(v)),
           n = ego_size(g, 2, v, mindist = 2))
#>   student n
#> 1       1 3
#> 2       2 4
#> 3       4 2
#> 4       5 2
#> 5       3 1

Note that if student is not integer, you'll need to create a temporary integer id with match on the unique value and then index on the final output.

With tcrossprod:

library(data.table)
library(Matrix)

setDT(dat)
u <- unique(dat$student)
data.frame(
  student = u,
  n = colSums(
    tcrossprod(
      dat[,id := match(student, u)][
        ,.(i = id, j = .GRP), .(semester, course)
      ][,sparseMatrix(i, j)]
    )
  ) - 1L
)
#>   student n
#> 1       1 3
#> 2       2 4
#> 3       3 1
#> 4       4 2
#> 5       5 2
Gutenberg answered 9/7 at 17:34 Comment(3)
Your tcrossprod option is working perfectly, and the only one that works correctly in higher dimensions. Thanks!Affined
actually you can use ego_size(g, 2, v, mindist = 2), instead of calling ego_size twice, which should speed up a bitLita
Thanks! I thought I remembered that being an option, but I didn't notice it when I scanned the list of arguments.Gutenberg
L
3

Here is an igraph solution using bipartite_projection() and degree(), if you are interested

# simplify the raw dataset
df <- dat %>%
    distinct() %>%
    mutate(gid = paste0(semester, ",", course)) %>%
    select(student, gid)

# create a bipartite graph
g <- df %>%
    graph_from_data_frame() %>%
    set_vertex_attr("type", value = names(V(.)) %in% unique(df$student))

# bipartite projection
out <- g %>%
    bipartite_projection(which = "true") %>%
    degree() %>%
    {
        data.frame(
            student = as.integer(names(.)),
            n = .
        )
    }

which gives

  student n
1       1 3
2       2 4
3       3 1
4       4 2
5       5 2

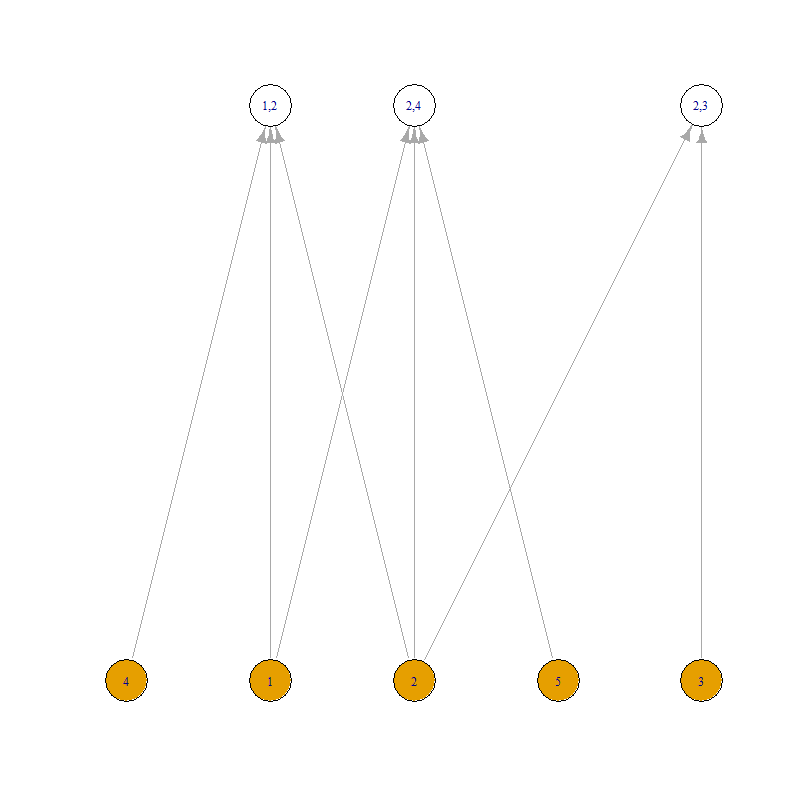
Explanation

  1. Build up a bipartite graph
g <- dat %>%
    distinct() %>%
    mutate(gid = paste0(semester, ",", course)) %>%
    select(student, gid) %>%
    graph_from_data_frame() %>%
    set_vertex_attr("type", value = names(V(.)) %in% unique(dat$student))

and its visualization looks like

g %>%
    plot(layout = layout_as_bipartite, vertex.color = V(g)$type)

bipartite graph

  1. Obtain the bipartite projections
g %>%
    bipartite_projection(which = "true") %>%
    plot()

such that bipartite projection

  1. The association between vertices is characterized by the degree of vertices. For example, vertex 1 (student 1) is of degree 3 (associated with vertices 2, 4 and 5), and so on.
Lita answered 10/7 at 12:22 Comment(2)
I think it is not easy to find a faster non-igraph working method.Culbert
@Culbert no, not easy, but maybe using Rcpp may make itLita
C
2

This is a follow-up to @jblood94's answer. It relies only on built-in R functions and igraph. Nothing is assumed about the students ids.

dat <-
  data.frame(
  student  = c(1, 1, 2, 2, 2, 3, 4, 5),
  semester = c(1, 2, 1, 2, 2, 2, 1, 2),
  course   = c(2, 4, 2, 3, 4, 3, 2, 4)
  )

library(igraph)
# Simplify input data.
ddf <- data.frame(student=dat$student, lectures =  paste0("L", dat$course, dat$semester))

# An edge from s to l means: student s attended lecture l.
# Make sure students come first.
# Make sure names and vertex indexes match if numeric.
g <- graph_from_data_frame(ddf, vertices = c(unique(ddf$student), unique(ddf$lectures)), directed=TRUE)

n_students <- length(unique(ddf$student))
v          <- V(g)[seq_len(n_students)]

system.time(
  answers <-
    data.frame(
      student = names(v),
            n = ego_size(g, 2, v, mindist = 2)
    )
)
head(answers)

# big data
#   user  system elapsed 
#   2.59    0.00    2.58 

Edit to append solution with native igraph functions

# ---------------------------------------------------------------------
library(igraph)
# Prepare input data.
students   <- dat$student
lectures   <- paste0("L", dat$course, dat$semester)
studentIds <- unique(students)
lectureIds <- unique(lectures)
n_sl       <- length(studentIds) + length(lectureIds)

# An edge from s to l means: student s attended lecture l.
g <- 
make_empty_graph(n_sl, directed=TRUE) %>%
  set_vertex_attr(name="name", value=c(studentIds, lectureIds))  %>%
    add_edges(rbind(students, lectures))

system.time(
answer <- setNames(ego_size(g, 2, V(g)[studentIds], mindist = 2),
                   studentIds)
)
head(answer)

Edit to append bipartite projection

V(g)$type <- bipartite_mapping(g)$type
plot(g, layout=layout_as_bipartite)
system.time(bp <- bipartite_projection(g, which = "false"))
degree(bp)
#
#  big data
#  user  system elapsed 
#  52.38    4.32   56.84
Culbert answered 12/7 at 12:21 Comment(0)
A
1

This might be memory intensive but hopefully a step in the right direction.

library(data.table)
library(tictoc)

tic()

# Assume 1-n ids for the students
dat <- big_dat
n <- max(dat$student)
classmate <- matrix(FALSE, nrow=n, ncol=n)
setDT(dat)
grps <- dat[, .(list(student)), .(semester,course)][, V1]
for (g in grps) {
  for (i in g) {
    classmate[i, g] <- TRUE
  }
}
# if -1 student not present / id missing
data.table(student = seq_len(n), n = rowSums(classmate)-1)

toc()
# 6.48 sec elapsed
Averir answered 9/7 at 17:31 Comment(0)
A
1

Here is a approach similar to Errin's. I am creating a class list of all of the students in each class, merging them together for each student and counting the unique ones.
See comments for a step-by-step.

dat <- 
   data.frame(
      student = c(1, 1, 2, 2, 2, 3, 4, 5),
      semester = c(1, 2, 1, 2, 2, 2, 1, 2),
      course = c(2, 4, 2, 3, 4, 3, 2, 4)
   )

#create a data frame with a list of the students in each class
classes <- dat %>% group_by(semester, course) %>% summarize(otherstudents = n(), s=list(student))

#join the student information onto each class (one to many join)
newdat <- left_join(classes, dat, join_by(semester, course))
#loop through each student
classmates <-sapply(sort(unique(newdat$student)), function(i){
   #find the classes the student is taking, merge together the students list 
   #find the unqiue students
   #count the list and substrate 1 for the original student
   unlist(newdat$s[newdat$student ==i]) %>% unique() %>% length()- 1
})

answer <- data.frame(student= sort(unique(newdat$student)), n=classmates)
Apologetic answered 9/7 at 22:30 Comment(0)
L
1

It could be solved by igraph but I don't think you really need it, for example

dat %>%
    mutate(gid = cur_group_id(), .by = -student) %>%
    select(student, gid) %>%
    {
        rev(stack(rowSums(tcrossprod(table(.)) > 0) - 1))
    } %>%
    setNames(c("student", "n"))

and you will obtain

  student n
1       1 3
2       2 4
3       3 1
4       4 2
5       5 2

but I am not sure about its efficiency, may need more experiments.

Lita answered 9/7 at 23:20 Comment(0)
L
1

A non-igraph solution

lst <- with(dat, split(student, paste(semester, course)))
transform(
    data.frame(student = unique(dat$student)),
    n = sapply(student, \(s) sum(!duplicated(unlist(Filter(\(x) s %in% x, lst), use.names = FALSE)))) - 1
)

gives

  student n
1       1 3
2       2 4
3       3 1
4       4 2
5       5 2

but it might be slow if applied to big data due to nested loops under the hood.

Lita answered 13/7 at 9:27 Comment(5)
Indeed slow but not completely impractical. Concise and intriguing solution. I don't quite understand the role of transform(). On my machine, it takes 175 seconds instead of about 2.5 seconds for igraph.Culbert
@Culbert I used transform just to call the variable student from data.frame(student = unique(dat$student)). so I don't need to create a object for that data frameLita
@Culbert do you have student from somewhere else? in my code, it is from data.frame(student = unique(dat$student))Lita
Use unlist(..., use.names = FALSE), and move -1 outside sapply. This will give an significant improvement, from 175sec to 70sec.Culbert
@Culbert yes, that indeed improves, but improves more than what I thought! Thank you for your contribution.Lita

© 2022 - 2024 — McMap. All rights reserved.