Manually calculate AUC
Asked Answered
T

3

8

How can I obtain the AUC value having fpr and tpr? Fpr and tpr are just 2 floats obtained from these formulas:

my_fpr = fp / (fp + tn)
my_tpr = tp / (tp + fn)
my_roc_auc = auc(my_fpr, my_tpr)

I know this can't pe possible, because fpr and tpr are just some floats and they need to be arrays, but I can't figure it out how to do that so. I also know that I can compute AUC this way:

y_predict_proba = model.predict_proba(X_test)
probabilities = np.array(y_predict_proba)[:, 1]
fpr, tpr, _ = roc_curve(y_test, probabilities)
roc_auc = auc(fpr, tpr)

but I want to avoid using predict_proba for some reasons. So my question is: how can I obtain AUC having fp, tp, fn, tn, fpr, tpr? In other words, is it possible to obtain AUC without roc_curve?

Tarragon answered 14/6, 2018 at 0:50 Comment(3)
Are you sure fpr and tpr really "just" to floats, or are they numpy arrays?Ils
Yes, they are 2 floats values.Tarragon
Then you cannot calculate a ROC curve. You need to get the values at all thresholds like roc_curve(y_test, probabilities) returns (whether it's a numpy array, pandas Series or just a list doesn't matter).Ils
N
4

You can divide the space into 2 parts: a triangle and a trapezium. The triangle will have area TPR*FRP/2, the trapezium (1-FPR)*(1+TPR)/2 = 1/2 - FPR/2 + TPR/2 - TPR*FPR/2. The total area is 1/2 - FPR/2 + TPR/2. This is how you can get it, having just 2 points.

Noisome answered 17/6, 2018 at 0:30 Comment(1)
what about the total area of AUPRC? is this right? 1/2- recall/2+precision/2.Bac
P
17

Yes, it is possible to obtain the AUC without calling roc_curve.

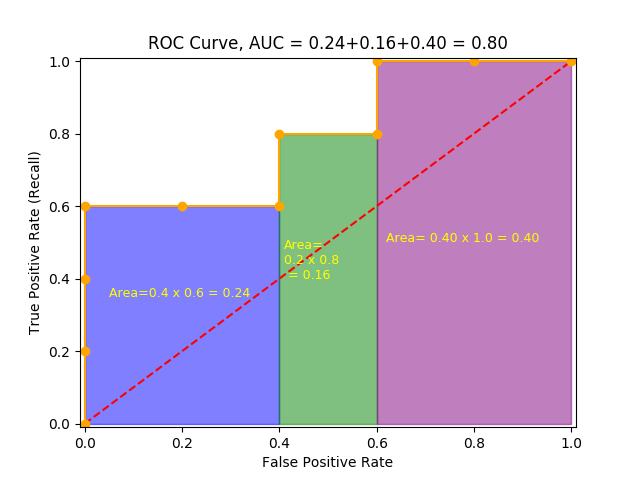
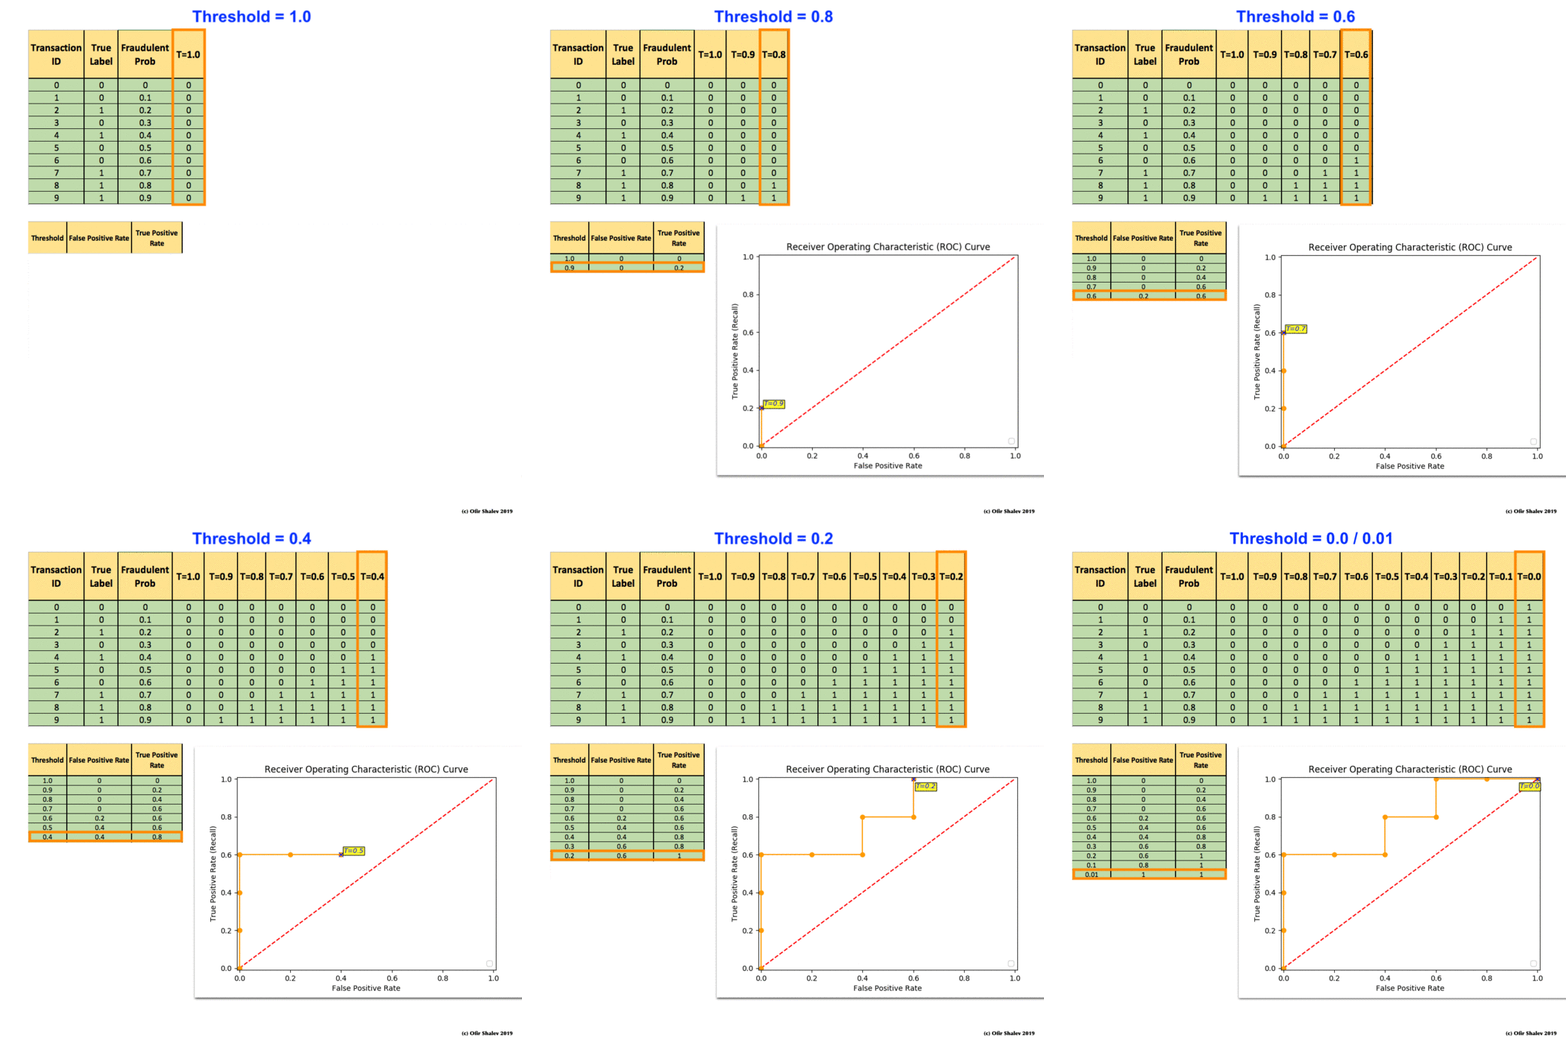
You first need to create the ROC (Receiver Operating Characteristics) curve. To be able to use the ROC curve, your classifier should be able to rank examples such that the ones with higher rank are more likely to be positive (e.g. fraudulent). As an example, Logistic Regression outputs probabilities, which is a score that you can use for ranking. The ROC curve is created by plotting the True Positive Pate (TPR) against the False Positive Rate (FPR) at various threshold settings. As an example:

enter image description here

The model performance is determined by looking at the area under the ROC curve (or AUC)

enter image description here

You can find here the more detailed explanation.

Packsaddle answered 28/5, 2019 at 5:58 Comment(0)
N
4

You can divide the space into 2 parts: a triangle and a trapezium. The triangle will have area TPR*FRP/2, the trapezium (1-FPR)*(1+TPR)/2 = 1/2 - FPR/2 + TPR/2 - TPR*FPR/2. The total area is 1/2 - FPR/2 + TPR/2. This is how you can get it, having just 2 points.

Noisome answered 17/6, 2018 at 0:30 Comment(1)
what about the total area of AUPRC? is this right? 1/2- recall/2+precision/2.Bac
L
-1
from sklearn import metrics

my_fpr = fp / (fp + tn)
my_tpr = tp / (tp + fn)
my_roc_auc = metrics.auc([0, my_fpr, 1], [0, my_tpr, 1])

The key idea is to add two more points (FPR=0, TPR=0 and FPR=1, TPR=1) for AUC calculation. These two points always exist in the ROC curve.

Leff answered 28/2 at 12:45 Comment(0)

© 2022 - 2024 — McMap. All rights reserved.