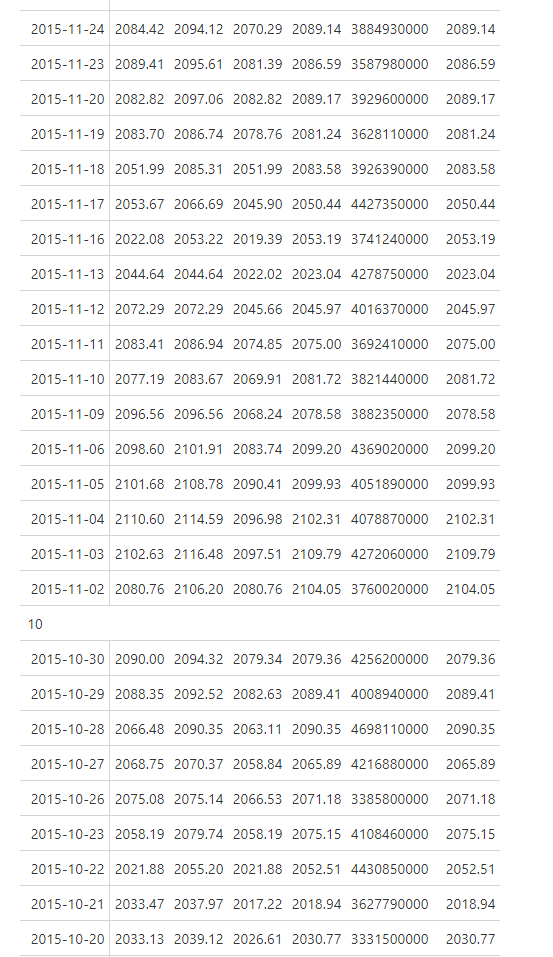
I am creating a table using the gt package in R Studio, and I can't figure out a graceful way to make the columns more readable for tables with many rows.
Take the following code:
gt::sp500 %>% slice(1:100) %>%
  mutate(month = lubridate::month(date)) %>%
  group_by(month) %>%
  gt::gt(rowname_col = "date")
As you see below, the columns are visible through the first ~35 rows...

But once you move beyond that, I find myself having to scroll up to remember which column is high and which is low, and whether adjusted close is in the 6th column or the 4th. Is there a way to either freeze those columns in place as you scroll (using the gt package), or easily repeat the column headers after each group (without messing with the underlying data)?

