I am willing to apply Fourier transform on a time series data to convert data into frequency domain. I am not sure if the method I've used to apply Fourier Transform is correct or not? Following is the link to data that I've used.
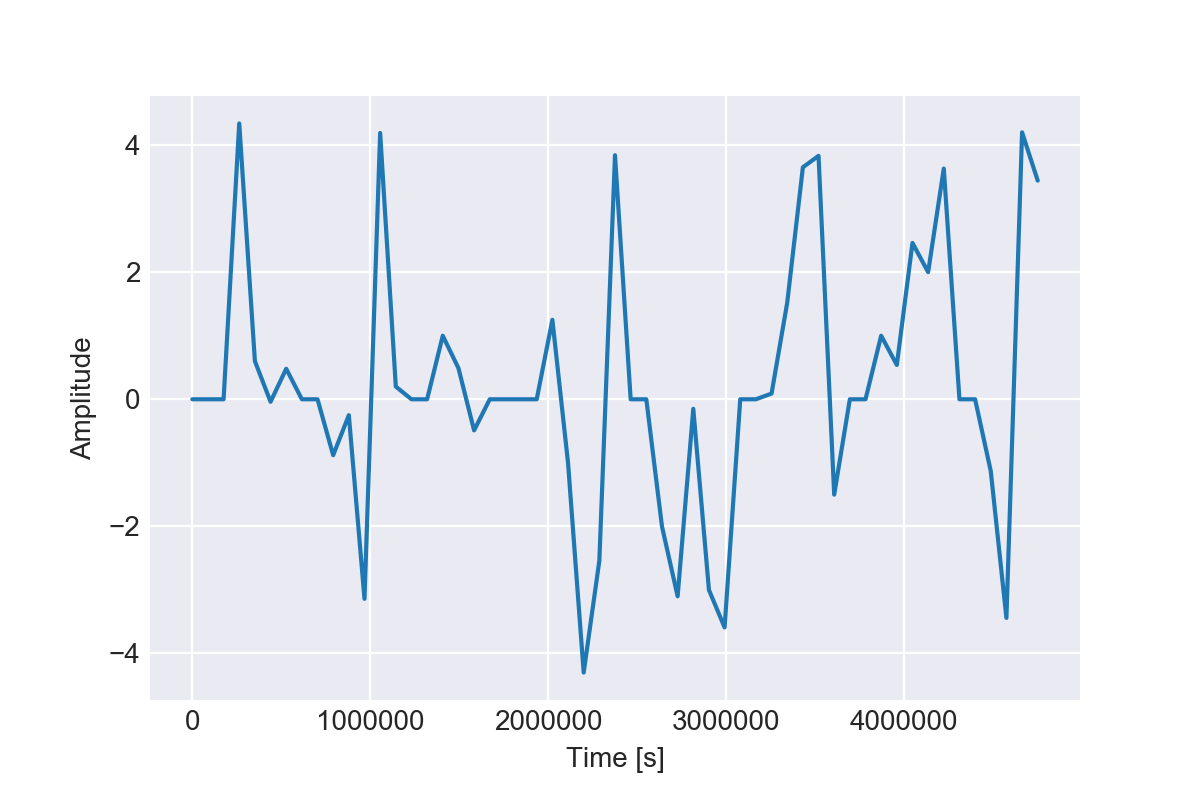
After reading the data file I've plotted original data using
t = np.linspace(0,55*24*60*60, 55)
s = df.values
sns.set_style("darkgrid")
plt.ylabel("Amplitude")
plt.xlabel("Time [s]")
plt.plot(t, s)
plt.show()
Since the data is on a daily frequency I've converted it into seconds using 24*60*60 and for a period of 55 days using 55*24*60*60
Next I've implemeted Fourier Transform using following piece of code and obtained the image as follows:
#Applying Fourier Transform
fft = fftpack.fft(s)

#Time taken by one complete cycle of wave (seconds)
T = t[1] - t[0]

#Calculating sampling frequency
F = 1/T

N = s.size

#Avoid aliasing by multiplying sampling frequency by 1/2
f = np.linspace(0, 0.5*F, N)

#Convert frequency to mHz
f = f * 1000

#Plotting frequency domain against amplitude
sns.set_style("darkgrid")
plt.ylabel("Amplitude")
plt.xlabel("Frequency [mHz]")
plt.plot(f[:N // 2], np.abs(fft)[:N // 2])
plt.show()
I've following questions:
I am not sure if my above methodology is correct to implement Fourier Transform.
I am not sure if the method I am using to avoid aliasing is correct.
If, what I've done is correct than how to interpret the three peaks in Frequency domain plot.
Finally, how would I invert transform using only frequencies that are significant.


f = np.linspace(0, 0.5*F, N)is wrong. I suggest you usenp.fft.fftfreq()to compute the frequency values associated to each sample. – Cue