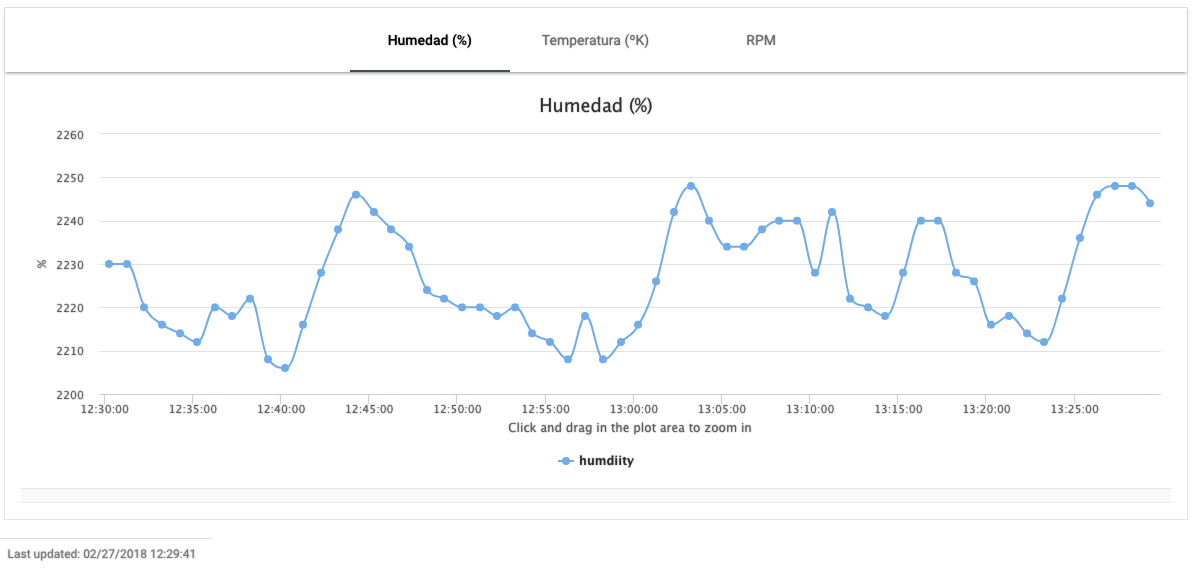
im having this issue which is breaking my head right now and I cant figured out what is the problem. I have a form called device-form, which is called from the dashboard using routing. The device form has inside 4 tabs (angular material), and the second one must show a Highchart component, when you select that tab, the container appears but not the chart.... if you wait, the chart will never show up, but if you click in any place the chart appears, also if you hover some item with mouse, or if you resize the screen!!
App-chart-box.component.html:
<mat-card fxFlex="100%" fxLayout="row">
<mat-card-title></mat-card-title>
<mat-card-content>
    <mat-tab-group class="form-wizard tab-group">
        <mat-tab *ngFor="let chart of charts; let i = index">
            <ng-template mat-tab-label>
                {{ chart.sensorTypeName }}
            </ng-template>
            <div class="tab-content">
                <vr-chart class="card-img-top" [title]="chart.sensorTypeName" [yTitle]="chart.sensorTypeUnit" type="spline" [series]="chart.series"
                    [period]="period" [minThreshold]="minThreshold" [maxThreshold]="maxThreshold"></vr-chart>
            </div>
        </mat-tab>
    </mat-tab-group>
</mat-card-content>
<mat-card-actions>
    <small class="footer">Last updated: {{ dateUpdated }}</small>
</mat-card-actions>
device-form.component.html:
 <mat-tab>
      <ng-template mat-tab-label>
        <div fxLayout="row" fxLayoutAlign="start center" fxLayoutGap="8px">
          <span>Statistics</span>
        </div>
      </ng-template>
      <div fxFlex="100%" class="shipping-address" fxLayout="column">
        <mat-form-field class="select-period">
          <mat-select placeholder="{{ 'DEVICE_FORM.PERIOD' | translate }}" [(ngModel)]="filterPeriodSelected" (change)="loadDeviceChart()">
            <mat-option *ngFor="let period of chartPeriods" [value]="period.value">
              {{ period.label | translate }}
            </mat-option>
          </mat-select>
        </mat-form-field>
        <!-- <div *ngIf="deviceCharts.length == 0" class="alert bg-primary alert-dismissible fade show" role="alert">
          <strong class="ng-tns-c6-44"> {{'MESSAGE.NO_DATA_TO_SHOW' | translate}}</strong>
        </div> -->
        <vr-chart-box *ngIf="deviceCharts" class="fix-width" [charts]="deviceCharts" [period]="filterPeriodSelected"></vr-chart-box>
      </div>
    </mat-tab>
As you see the app-chart-box component is rendered, actually we can always see the footer loaded, always, but the body of the chart dont appear until click or hover o whatever.
Update: Actually Im having the very same issue with a table which is filled with data coming from an API when you change a dropdown up there in the main dashboard page, the table component is always listening to .onCompanyChange.subscribe, read all the data, but the table is not showing until you make click or hover or whatever event... this is the code : Table component:
export class CompanyHistoryComponent implements OnInit {
  @ViewChild('tableInput') tableInput: ElementRef;
  @Input() companyId = 0;
  private rows: Observable<Array<any>>;
  // public rows: any[] = [];

  resultsLength: number;
  dataSource: ListDataSource<any> | null;
  database: ListDatabase<any>;
  tableHover = true;
  tableStriped = true;
  tableCondensed = true;
  tableBordered = true;

  constructor(
    public sensorService: SensorService,
    public dashboardService: DashboardService,
    private cd: ChangeDetectorRef,
  ) {
    // Selected company changed
    this.dashboardService.onCompanyChange.subscribe(
      (id: number) => {
        this.companyId = id;
        this.loadSensorHistory();
        cd.detectChanges();
      });
  }

  public loadSensorHistory() {
    const sDate: Number = moment().subtract(30, 'day').unix()
    const eDate: Number = moment().unix();

    this.sensorService.getSensorDataHistory(this.companyId, sDate, eDate, null, null, 1, 10).subscribe(response => {
      if (response.statusCode !== 200 || !response.data) {
        // this.toastrService.error('MESSAGE.NO_DATA', 'SENSOR_FORM_LIST.TITLE', { positionClass: 'toast-top-right', closeButton: true });
      } else {
        this.rows = response.data.list;
      }
    });
  }
  ngOnInit() {

  }
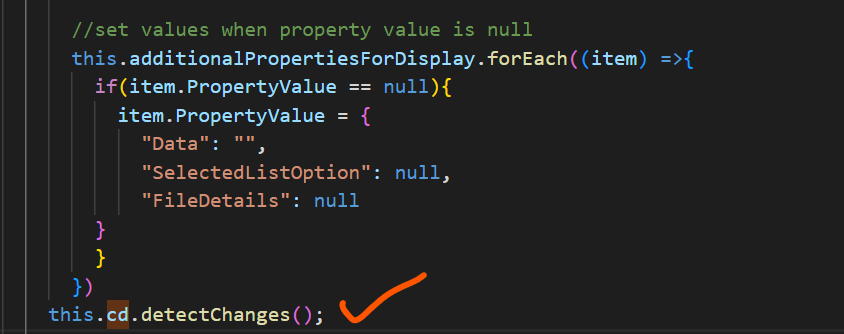
As you see this time I added detectChanges() without any results :( let me know if you have an idea. This is the HTML of the Table :
<table class="table" [class.table-hover]="tableHover" [class.table-striped]="tableStriped" [class.table-condensed]="tableCondensed"
  [class.table-bordered]="tableBordered">
  <thead>
    <tr>
      <th>Date</th>
      <th>Device</th>
      <th>Sensor</th>
      <th>Value</th>
    </tr>
  </thead>
  <tbody>
    <tr *ngFor="let row of rows" [class.row-failed]="row.failed > 0">
      <td>{{ row.data_createdDate | date:'MM/dd/yyyy HH:mm:ss a Z' }}</td>
      <td>
        <a href="">{{ row.deviceMAC }}</a>
      </td>
      <td>
        <a href="">{{ row.sensorNumber }} - {{ row.sensorName }}</a>
      </td>
      <td>{{ row.value }}</td>
    </tr>
  </tbody>
</table>


