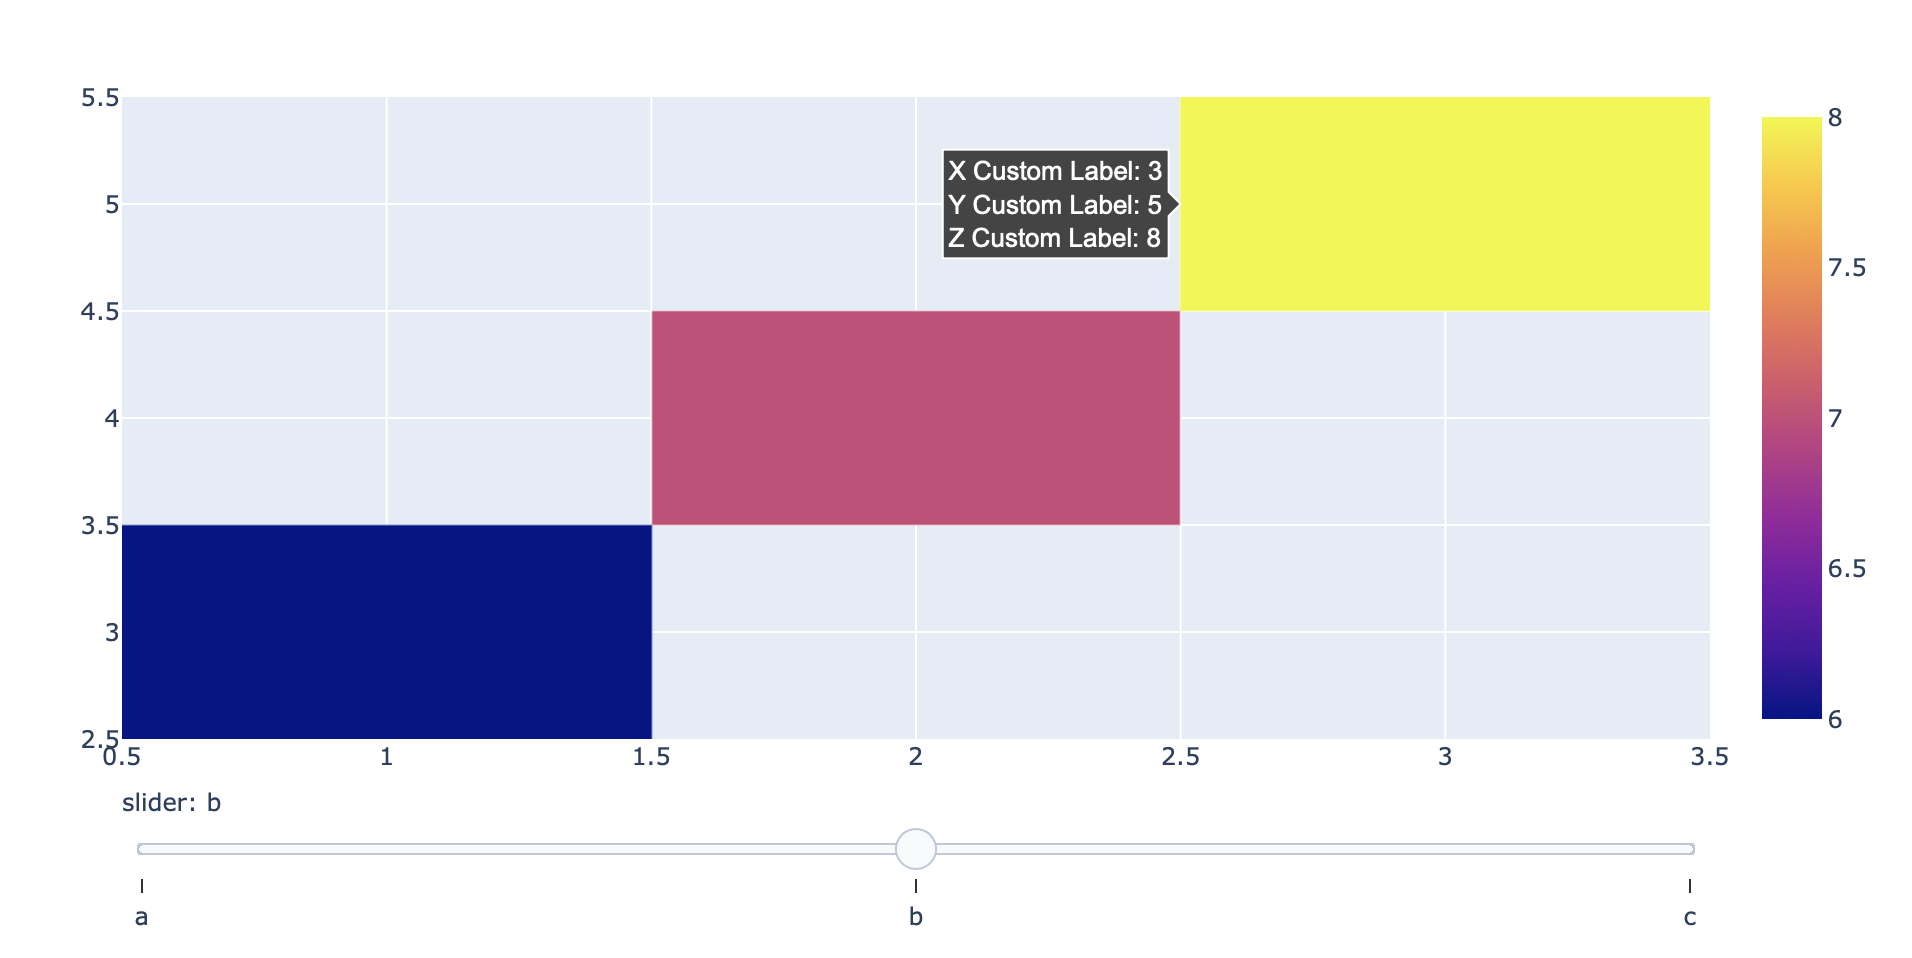
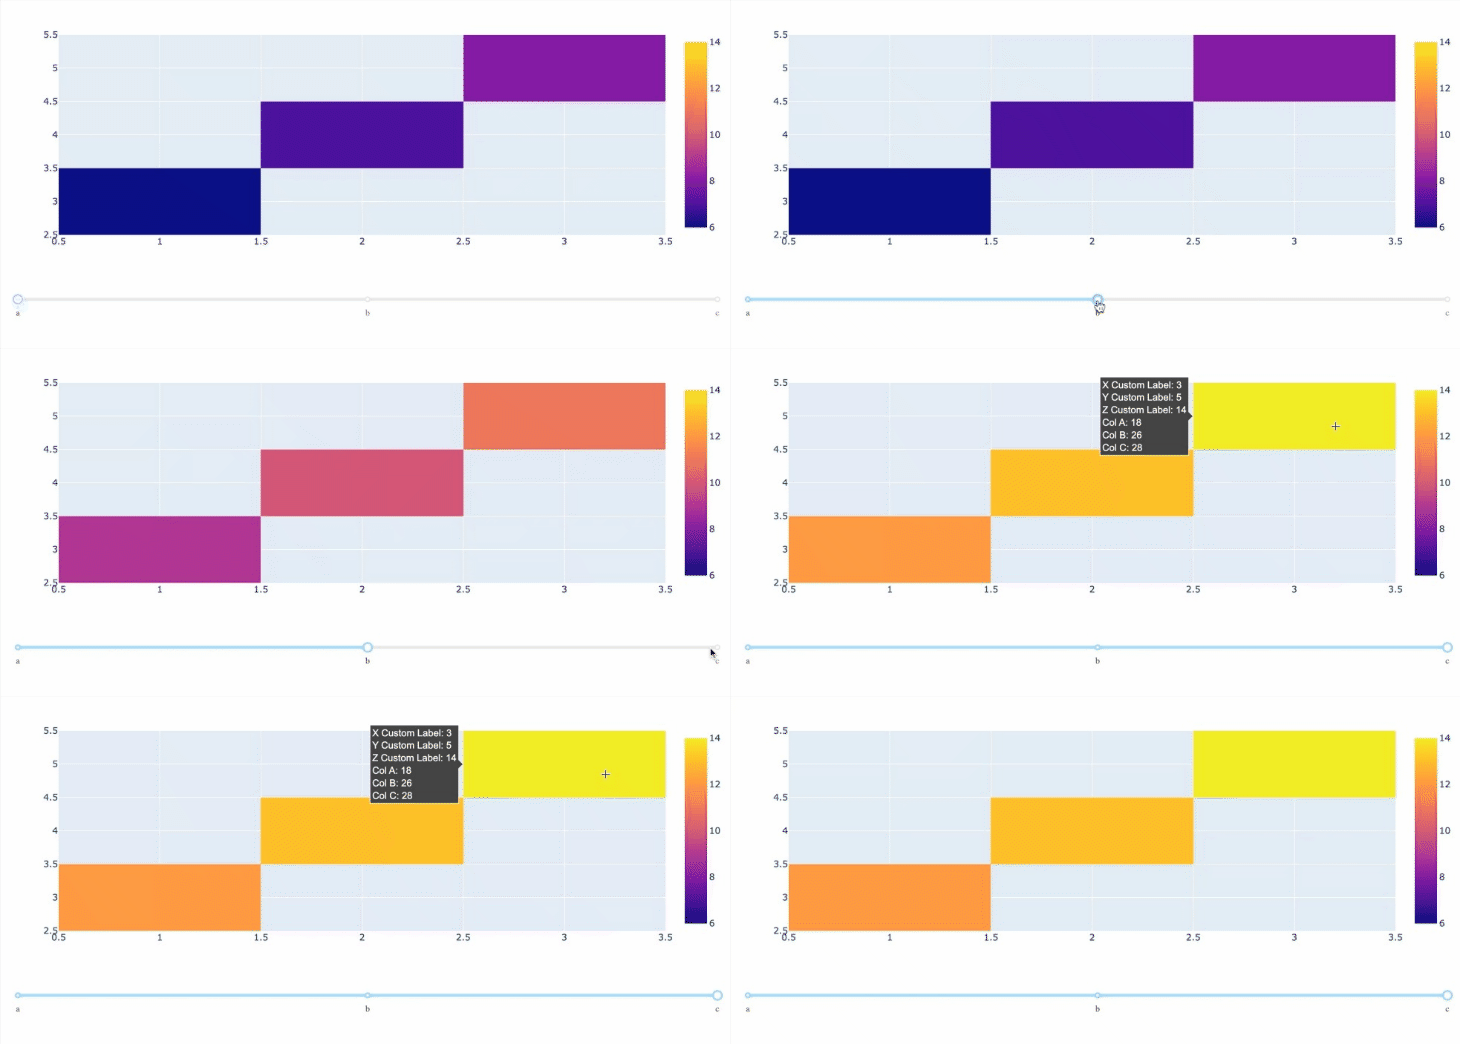
The main problem is that when you pass slider information to the sliders argument in the fig.update_layout method, there isn't an easy way to retrieve the value of the slider when it is being used live. This means that even with a callback where we pass the figure as an input, we don't have an easy way of updating the hovertemplate because the state of the slider isn't known as you're using it.
We can get around this by using instead using dcc.Slider to render the slider – this will be separate from the figure so we don't run into the issue of having to retrieve the slider value from within the plotly figure.
However, from the documentation, I believe that dcc.Slider only allows numerical values – so when we define the slider, we need to provide numerical values like 0, 1, 2,... and create a dictionary to map them to your categories 'a', 'b', 'c',...,. Then when we use the callback to retrieve the slider values, we use the same dictionary so that we know which category on the slider was selected (similar to the example here). Then in the callback, we can update both the data in the figure and the hovertemplate accordingly.
To get multiple columns of data into the hovertemplate, you'll want to pass multiple columns of your df to the customdata parameter as described in this answer.
I know this is out of the scope of your question, but I noticed that the scale of the heatmap changes every time you toggle the slider because the input data changes – whether data in the heatmap spans values from 10-12 or 20-22, the colors will remain unchanged. So I added zmin and zmax arguments to go.Heatmap based on the global min and max of values in your data, but if this isn't what you want, feel free to drop these arguments.
import numpy as np
import pandas as pd
import plotly.graph_objects as go

import dash
from dash import Input, Output, State, ctx, dcc, html
from dash.exceptions import PreventUpdate

# create Pandas dataframe
df = pd.DataFrame({'x_label': [1,2,3,1,2,3,1,2,3], 'y_label': [3,4,5,3,4,5,3,4,5], 'z_label':[6,7,8,9,10,11,12,13,14],
                   'A': [10, 11, 12,13,14,15,16,17,18], 'B': [10, 12, 14,16,18,20,22,24,26], 'C': [12, 14, 16,18,20,22,24,26,28],
                   'slider':['a','a','a','b','b','b','c','c','c']})


# create dictionary mapping slider category to dataframe filtered by slider category
slider_df_dict = {
    slider_value:df_group for
    slider_value, df_group in df.groupby("slider")
}

zmin, zmax = min(df['z_label']), max(df['z_label'])
customdata = np.stack((df['A'], df['B'], df['C']), axis=-1)
slider_values = list(slider_df_dict.keys())

# create and name each frame in the heatmap based on the slider name
frames = [
    go.Frame(data=go.Heatmap(
            z=df['z_label'],
            x=df['x_label'],
            y=df['y_label'],
            customdata=customdata,
            zmin=zmin,
            zmax=zmax
        ),
        name=slider_name,
    )
    for slider_name, df in slider_df_dict.items()
]

# plot the heatmap figure
fig = go.Figure(data=frames[0].data, frames=frames)

# update hovertemplate labels and information
fig.update_traces(
        hovertemplate="X Custom Label: %{x}"
                    "<br>Y Custom Label: %{y}"
                    "<br>Z Custom Label: %{z}"
                    "<br>Col A: %{customdata[0]}"
                    "<br>Col B: %{customdata[1]}"
                    "<br>Col C: %{customdata[2]}"
                    "<extra></extra>"
    )

app = dash.Dash()

## if i am not mistaken, categorical dash slider has not been implemented yet
## so we still need to pass numbers and then display the marks as categories
slider_value_to_mark_dict = {i:s for i,s in enumerate(slider_values)}

app.layout = html.Div([
    dcc.Graph(figure=fig, id="fig-heatmap"),
    dcc.Slider(
        min=0,
        max=len(slider_values)-1,
        step=1,
        marks=slider_value_to_mark_dict, id="slider")
])

@app.callback(
    Output("fig-heatmap", "figure"),
    Input("slider", "value"),
    prevent_initial_call=True,
)
def update_fig(slider_value):
    slider_mark = slider_value_to_mark_dict[slider_value]
    slider_df = slider_df_dict[slider_mark]
    customdata = np.stack((slider_df['A'], slider_df['B'], slider_df['C']), axis=-1)
    frames = [
        go.Frame(
            data=go.Heatmap(
                z=slider_df['z_label'],
                x=slider_df['x_label'],
                y=slider_df['y_label'],
                customdata=customdata,
                zmin=zmin,
                zmax=zmax
                ),
            name=slider_mark,
        )
    ]
    fig = go.Figure(data=frames[0].data, frames=frames)
    fig.update_traces(
        hovertemplate="X Custom Label: %{x}"
                    "<br>Y Custom Label: %{y}"
                    "<br>Z Custom Label: %{z}"
                    "<br>Col A: %{customdata[0]}"
                    "<br>Col B: %{customdata[1]}"
                    "<br>Col C: %{customdata[2]}"
                    "<extra></extra>"
    )
    return fig

app.run_server(debug=True, use_reloader=False)
![enter image description here]()


plotly-dashas a tag, would you consider a plotly-dash solution? – Mireielle