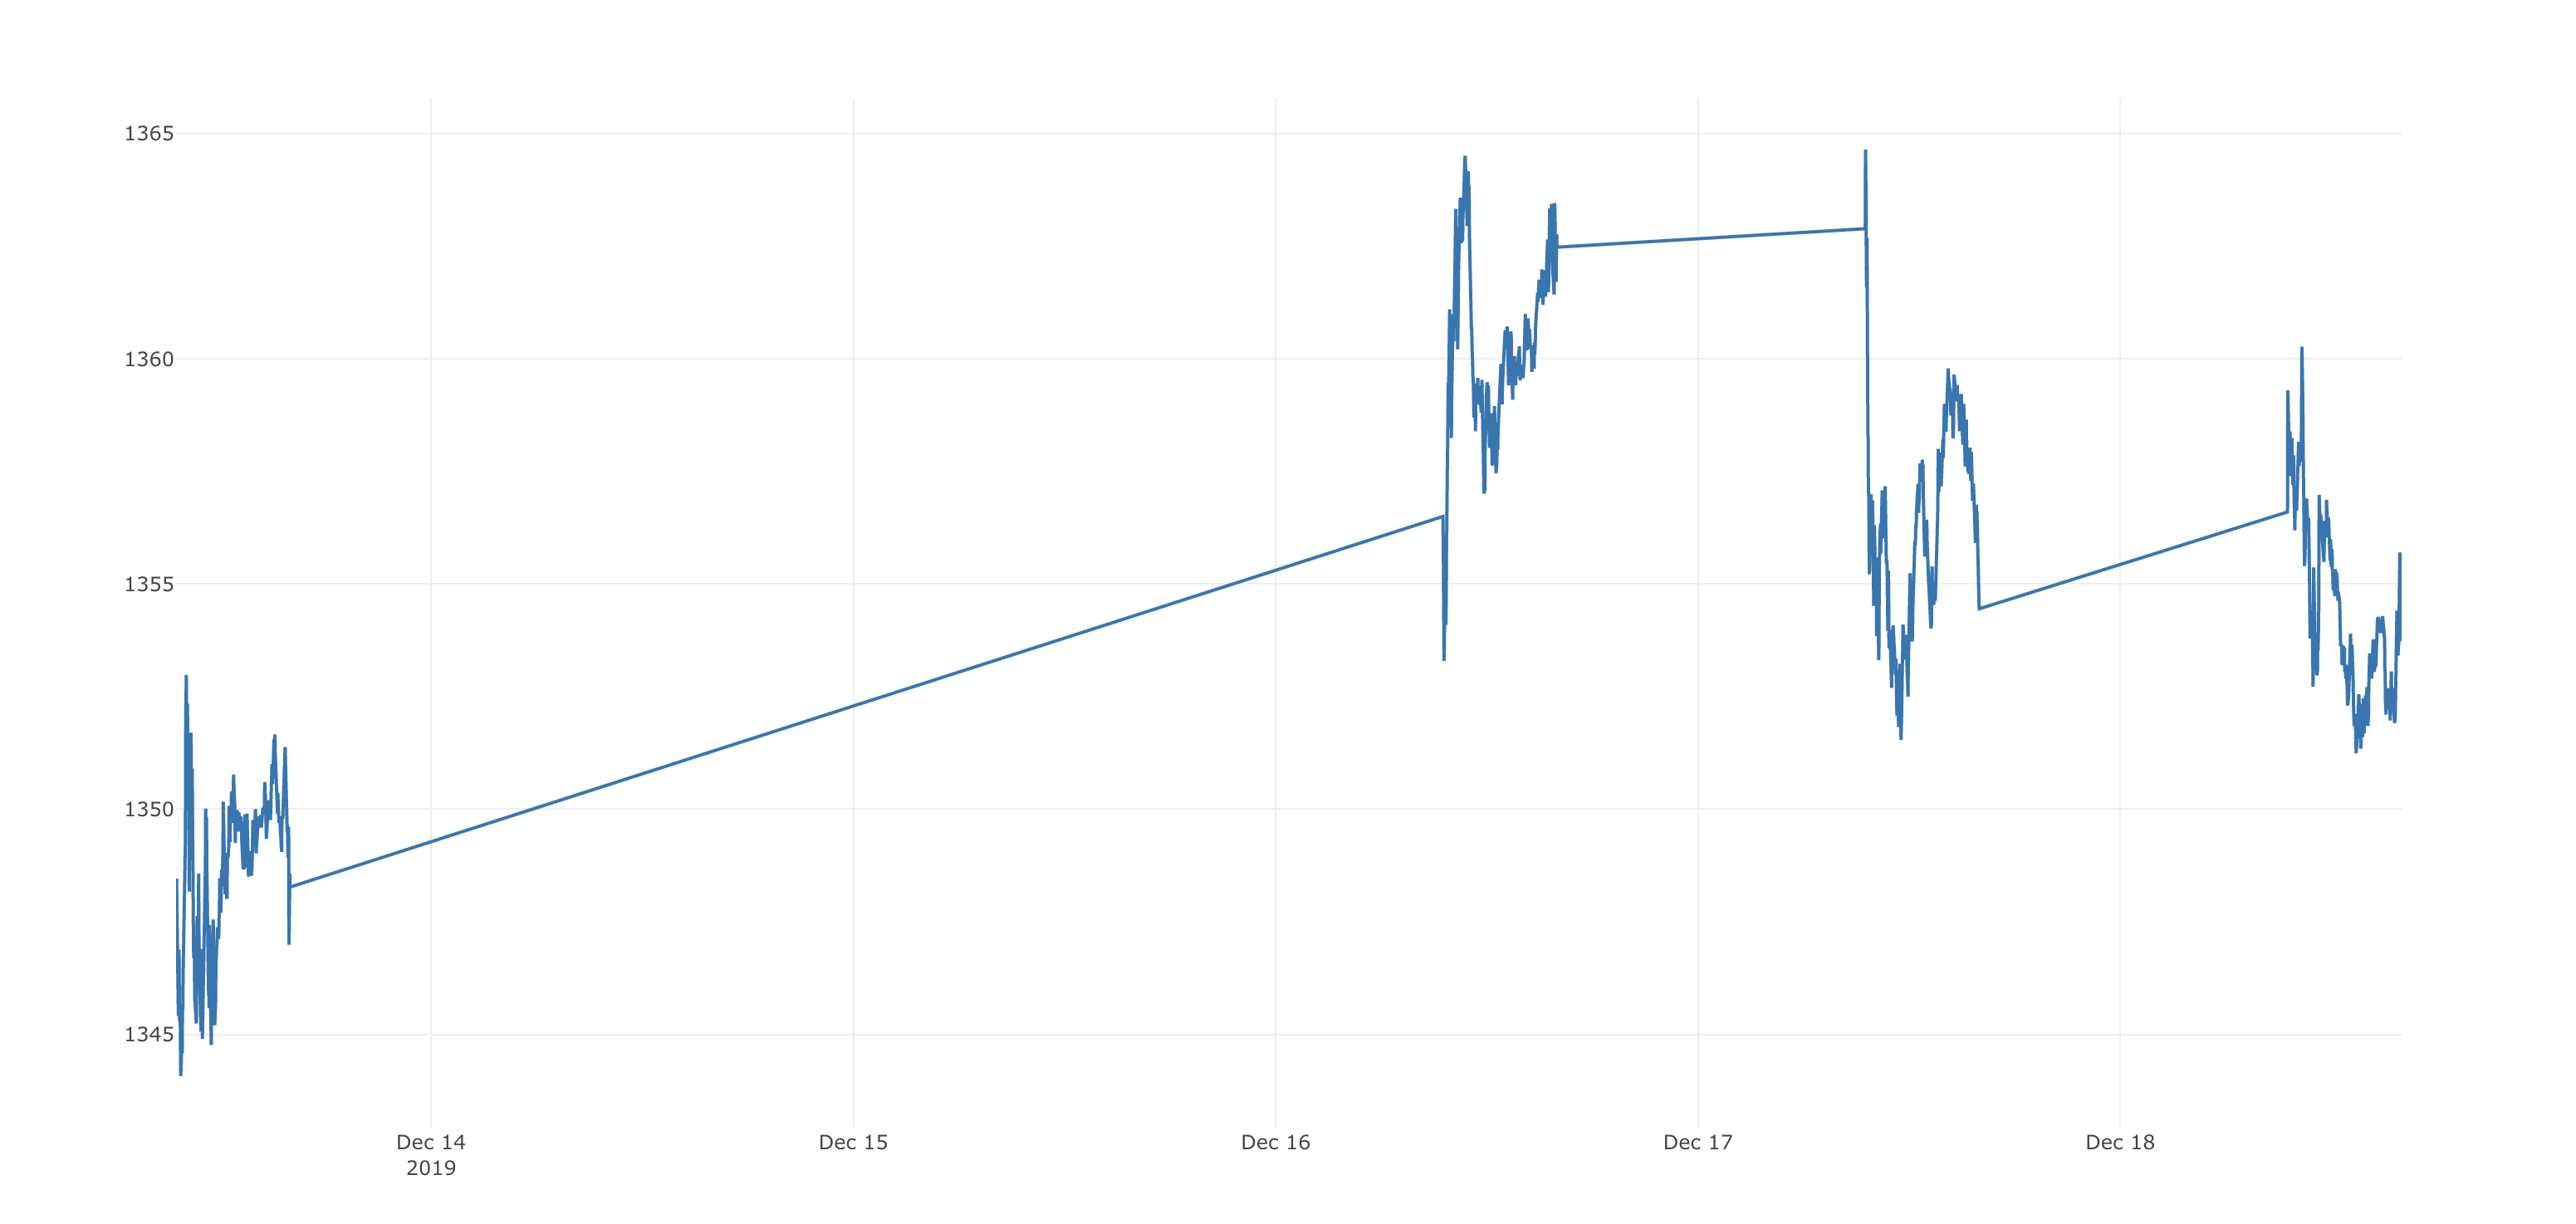
I am trying to plot stock data, but there are gaps in the graph where data for these time periods don't exist. How do I remove these gaps? I found that there is an update_xaxes function but I'm not sure how to apply it to my case.
My code:
import React, { useState, Component, useEffect } from "react";
import Plot from 'react-plotly.js';

export const Chart = () => {

    return (
        <div>
            <Plot
                data={[
                    {
                        x: data['dates'],
                        y: data['open_price'],
                        type: 'scatter'
                    }
                ]}
                layout={{
                    autosize: false,
                    width: 1500,
                    height: 800,
                 xaxis: {
                        color: 'red',
                        rangebreaks: {
                            bounds: ["sat", "mon"],
                            values: ["2015-12-25", "2016-01-01"],
                            bounds: [17, 9], pattern: "hour"
                        }
                    }
                }}
            />
        </div>
    )
}


rangebreaksin javascript, and how to use them in Python? The official reference can be found here. – Cinchonize