Why is Chrome showing extra line when using Google org chart?
Asked Answered
H

8

9

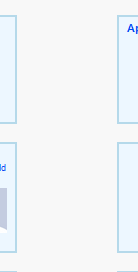
I am using Google org chart and it works great on every browser except Chrome. On Chrome I see these extra lines in between the boxes like this:

Chrome browser

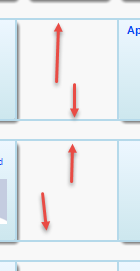
For all other browsers, the same page shows up as this:

Other browser

As you can see there are no blue lines in between the nodes. When I look in firebug or chrome dev tools it appears that its:

.google-visualization-orgchart-node

border: 2px solid #b5d9ea;

That is causing the issue because if i change the border to 0px then the issue goes away (but the border on the actual nodes also goes away which is obviously an issue.

Any suggestion for how to render this correctly in Chrome. I don't see this issue happening in the demo link above.

Hunch answered 14/2, 2016 at 22:19 Comment(6)
Can you reproduce the bug in a fiddle?Choe
I have just tried and It does not do that to me jsfiddle.net/xhiena/wd1kLdg5/2Bokbokhara
can you show the original code / is it public? maybe the sourcecode of the rendered site from chrome?Ruhl
Can you also post exactly which version of Chrome has this issue? (I also don't see it in Pablo Martinez' fiddle, either on 48.0.2564.109, or 50.0.2657.0)Disembodied
Which version of Chrome are you using? I cannot reproduce this issue on 48.0.2564.116.Flea
It looks like your browser is adding the blue focus line on all your objects (as this is what Chrome does and other browsers not). You might want to try adding this your CSS: *:focus { outline: none; } and see if it solves the problemPreeminent
F
4
.google-visualization-orgchart-linenode {
    border: 0;
}
Featly answered 22/2, 2016 at 18:8 Comment(2)
this wasn't the exact correct answer but it led me to the css that i had that was overriding by accident so i ahve accepted the answer and awarded the bountyHunch
Remember to delete browser cache data, this was my error and the reason of this code didn't work... but now it's working :DStich
A
17

In my case it was Bootstrap 3 with

border-collapse: collapse;

that was the cause. Fixed it with setting

table.google-visualization-orgchart-table {
    border-collapse: separate;
}
Amazonite answered 26/8, 2016 at 7:19 Comment(1)
This is my problem as well!Pindus
F
4
.google-visualization-orgchart-linenode {
    border: 0;
}
Featly answered 22/2, 2016 at 18:8 Comment(2)
this wasn't the exact correct answer but it led me to the css that i had that was overriding by accident so i ahve accepted the answer and awarded the bountyHunch
Remember to delete browser cache data, this was my error and the reason of this code didn't work... but now it's working :DStich
A
0

Check whether you have any border rule applied for this css class .google-visualization-orgchart-linenode

Angst answered 22/2, 2016 at 17:59 Comment(0)
B
0

I would try Patrick's answer of setting the .google-visualization-orgchart-linenode {border: 0}. If that doesn't work try setting the border-collapse property since its separate by default.

.google-visualization-orgchart-table,
.google-visualization-orgchart-table tr,
.google-visualization-orgchart-table td {
   border-collapse: collapse;
}

Although that's weird that its only showing in Chrome for you. Make sure you have your DOCTYPE setup correctly.

Boater answered 22/2, 2016 at 18:46 Comment(0)
P
0

Set the nodeClass option on the chart.draw with a color and background-color to override the default color scheme, which solves the problem in Chrome.

Set two css classes:

//css class for default tree node
.default-leaf { color:black; background-color:#DCDCDC; }

// css class for selected tree node
.selected-leaf { color:white; background-color:#191970; }

While initializing the chart set the nodeClass & selectedNodeClass options:

var chart = new google.visualization.OrgChart( document.getElementById('chart_div'));

// setting options - allowHtml (required for visuals to work), css classes for a tree-node & selected-tree-node
var options = { 'allowHtml': true, 'nodeClass': 'default-leaf', 'selectedNodeClass': 'selected-leaf'};
chart.draw(data, options);
Parfitt answered 7/4, 2016 at 10:57 Comment(0)
M
0

This is what I added to stop the random lines from showing up

<style>
    table{
        border-collapse: separate !important;
    }
</style>
Munch answered 14/4, 2016 at 17:42 Comment(0)
K
0

We had an incompatibility with normalize.css that caused this same issue for us. Adding the following CSS fixed it:

table.google-visualization-orgchart-table {
  border-collapse: inherit;
}
Kilohertz answered 25/4, 2016 at 22:56 Comment(0)
H
0

I also added the following to fix the issue:

table {
border-collapse: separate!important; 
}
Handwriting answered 25/7, 2017 at 18:38 Comment(0)

© 2022 - 2024 — McMap. All rights reserved.