R Shiny DataTable selected row color
Asked Answered
I

2

9

I am trying to set the highlight color for a selected row in a DataTable in my shiny app. Basically I want the color of selected rows to be say red rather than blue. However, I am not at all familiar with JavaScript so I am struggling to write the appropriate callback (at least I think that is the problem). Here is what I've tried so far:

# ui.R
library(shiny)

fluidPage(
  title = 'DataTables Test',
  DT::dataTableOutput('table')
)

# server.R
library(shiny)
library(DT)

# render the table
output$table = renderDataTable(datatable(head(iris, 20), 
options = list(
    initComplete = JS(
      "function(settings, json) {",
      "var rows = $(this.api().table().rows());",
      "for (var i = 0; i < rows.length; i++){ ",
      "var row = rows[i];",
      "row.css({'background-color': '#000', 'color': '#f00'})",
      "}",
      "}")
  )))

})

As you can see, so far I am just trying to figure out how to change the row colors. Once I had figured this out I was going to try and change the css to something like:

"tr.selected td, table.dataTable td.selected { background-color: #f00}"

But I haven't gotten there yet - unfortunately the code above doesn't do anything to the background color. If anyone could help me with the whole solution that would be great.

Inflame answered 7/7, 2017 at 9:56 Comment(5)
The DT package has some built in functions to change font colors/background colors. See hereTrometer
@GregordeCillia I have looked at those but I couldn't figure out how to color a row based on whether it was selected or not.Inflame
You can use a dataTableProxy and update the styling whenever input$table_rows_selected changesTrometer
Wait...there is no formatStyle equivalent for proxys. Maybe this approach doesn't work.Trometer
@GregordeCillia yeah I was about to say that I couldn't get it to work... Any other ideas? :)Inflame
C
19

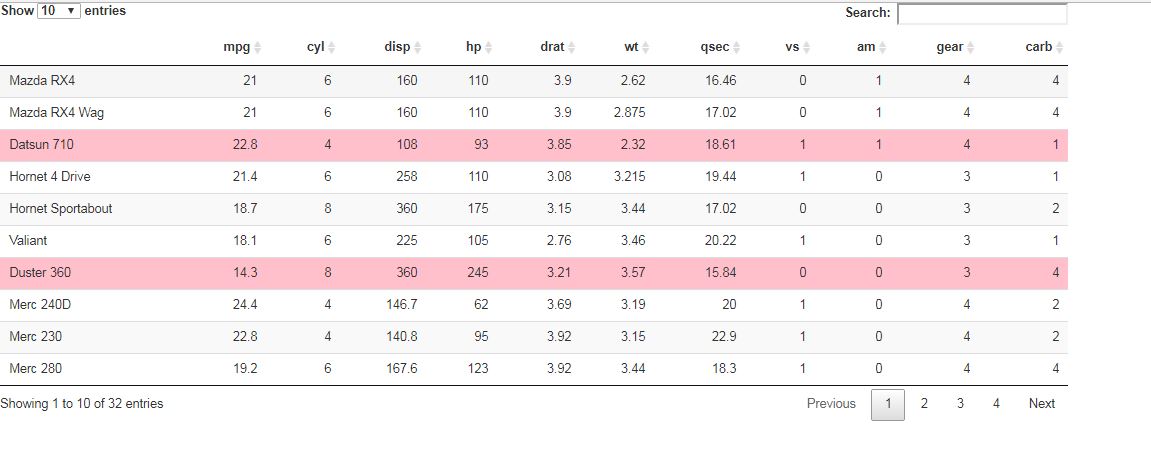
This should do the job:

#rm(list = ls())
library(shiny)
library(DT)

ui <- basicPage(
  tags$style(HTML('table.dataTable tr.selected td, table.dataTable td.selected {background-color: pink !important;}')),
  mainPanel(DT::dataTableOutput('mytable'))
)

server <- function(input, output,session) {

  output$mytable = DT::renderDataTable(    
    datatable(mtcars)
  ) 
}
runApp(list(ui = ui, server = server))

enter image description here

Connie answered 7/7, 2017 at 11:9 Comment(1)
Thank you very much for the above, it helped me with a similar problem. To set different colours for selected rows and columns, use: tags$style(HTML('table.dataTable tr.selected td{background-color: pink !important;}')), tags$style(HTML('table.dataTable td.selected {background-color: orange !important;}'))Strahan
R
2

In case anyone is having the same problem as me: if you are using the 'bootstrap' styling in datatable, you need to change ".selected" for ".active", otherwise it won't work. For example, in the answer provided by Pork Chop:

library(shiny)
library(DT)

ui <- basicPage(
  tags$style(HTML('table.dataTable tr.active td, table.dataTable tr.active {background-color: pink !important;}')),
  mainPanel(DT::dataTableOutput('mytable'))
)    

server <- function(input, output,session) {
  output$mytable = DT::renderDataTable(    
    datatable(mtcars, style="bootstrap")
  ) 
}

runApp(list(ui = ui, server = server))

EDIT: Since DataTables v1.12, background-color is not longer working: the property that controls now row colours is box-shadow (see: https://datatables.net/blog/2022-05-13#Row-colouring-improvements, https://www.w3schools.com/CSSREF/css3_pr_box-shadow.php).

tags$style(HTML('table.dataTable tr.selected td, table.dataTable tr.selected {box-shadow: inset 0 0 0 9999px pink !important;}'))

And with 'bootstrap' styling:

tags$style(HTML('table.dataTable tr.active td, table.dataTable tr.active {box-shadow: inset 0 0 0 9999px pink !important;}'))
Rousing answered 10/5, 2023 at 13:30 Comment(0)

© 2022 - 2024 — McMap. All rights reserved.