This is in reference to the following question, wherein options for adjusting title and layout of subplots are discussed: modify pandas boxplot output
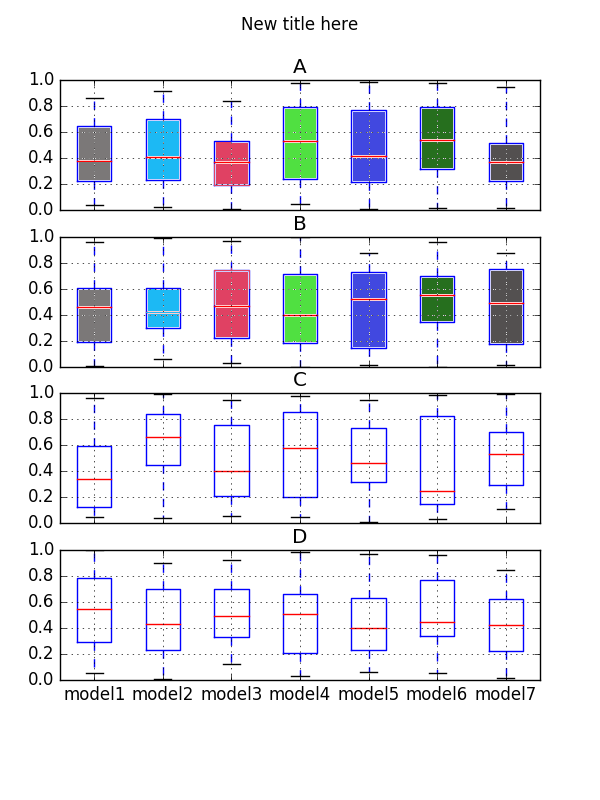
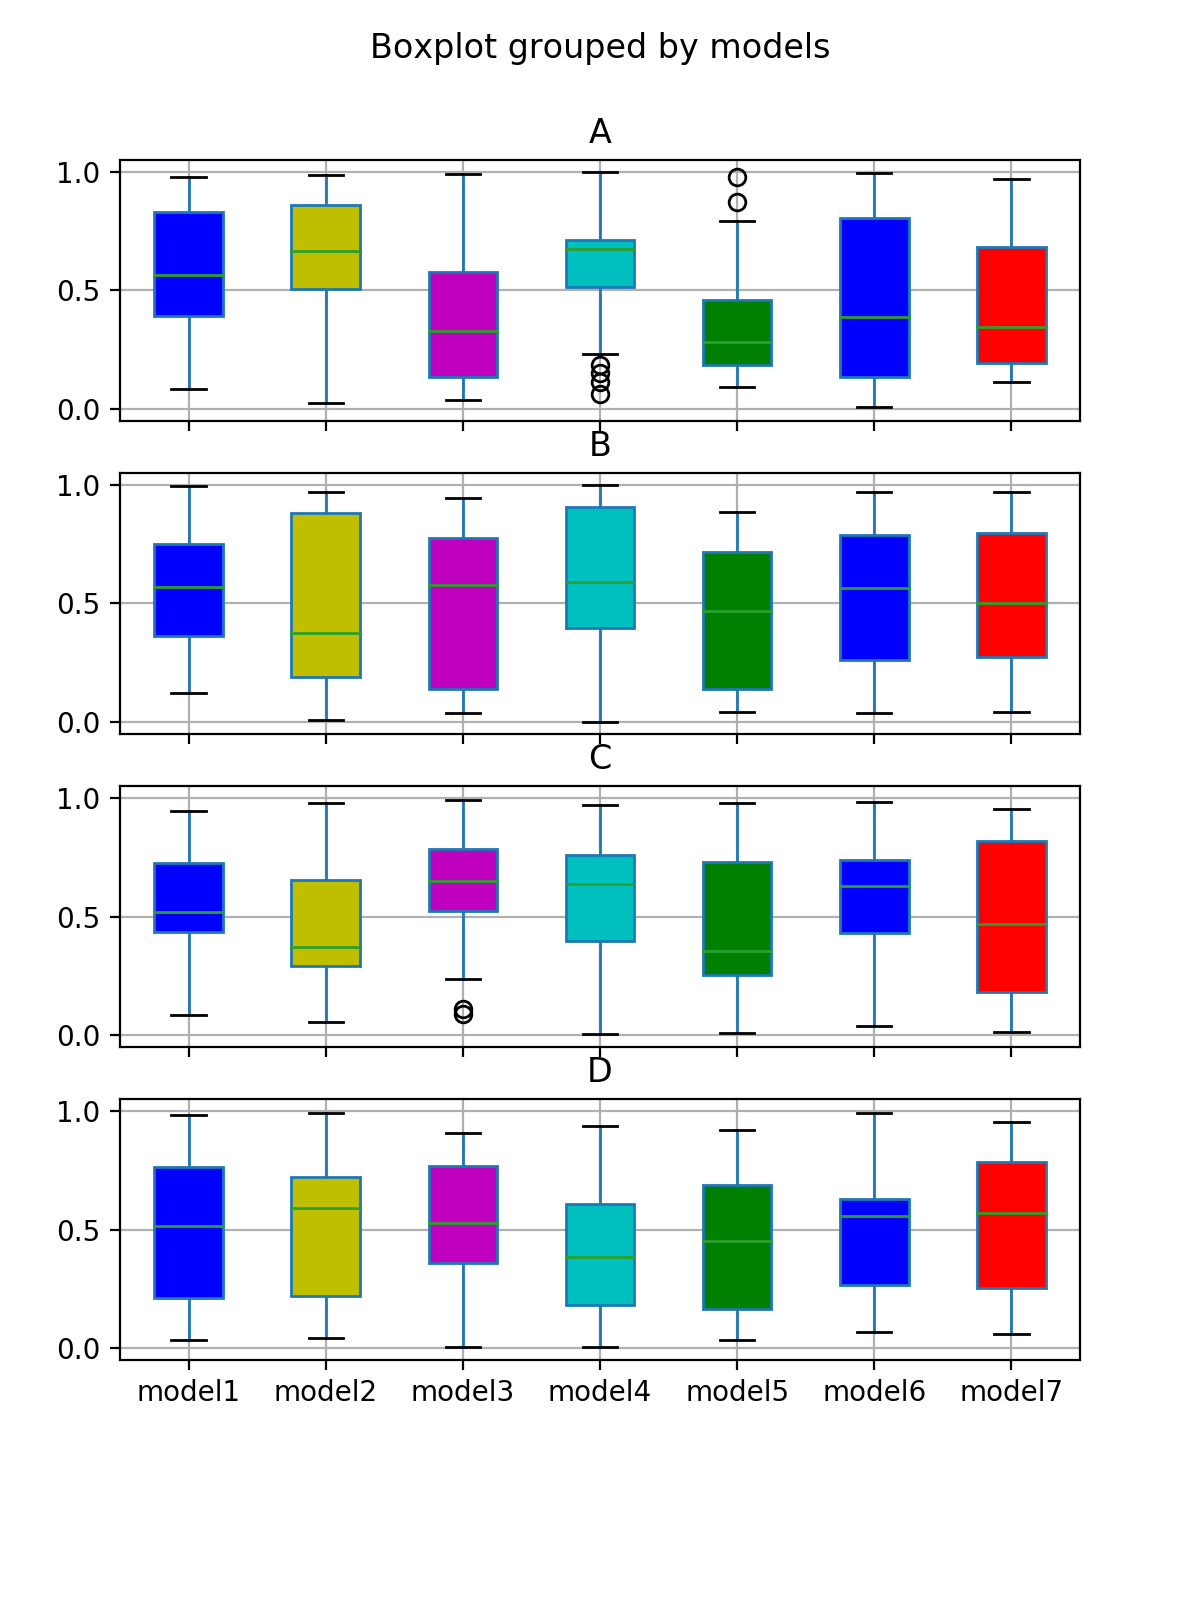
My requirement is to change the colors of individual boxes in each subplot (as depicted below):
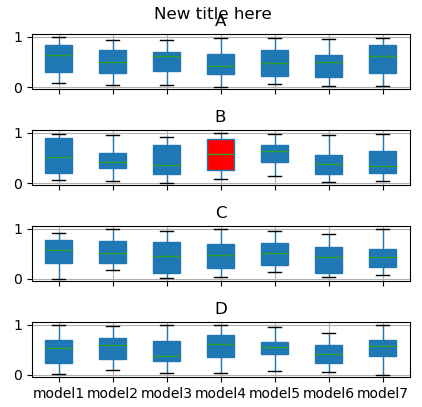
Following is the code available at the shared link for adjusting the title and axis properties of subplots:
import pandas as pd
import numpy as np
import matplotlib.pyplot as plt

df = pd.DataFrame(np.random.rand(140, 4), columns=['A', 'B', 'C', 'D'])
df['models'] = pd.Series(np.repeat(['model1','model2', 'model3', 'model4',     'model5', 'model6', 'model7'], 20))
bp = df.boxplot(by="models",layout=(4,1),figsize=(6,8))
[ax_tmp.set_xlabel('') for ax_tmp in np.asarray(bp).reshape(-1)]
fig = np.asarray(bp).reshape(-1)[0].get_figure()
fig.suptitle('New title here')
plt.show()
I tried using the: ax.set_facecolor('color') property, but not successful in obtaining the desired result.
I tried accessing bp['boxes'] as well but apparently it is not available. I need some understanding of the structure of data stored in bp for accessing the individual boxes in the subplot.
Looking forward
P.S: I am aware of seaborn. But need to understand and implement using df.boxplot currently. Thanks


